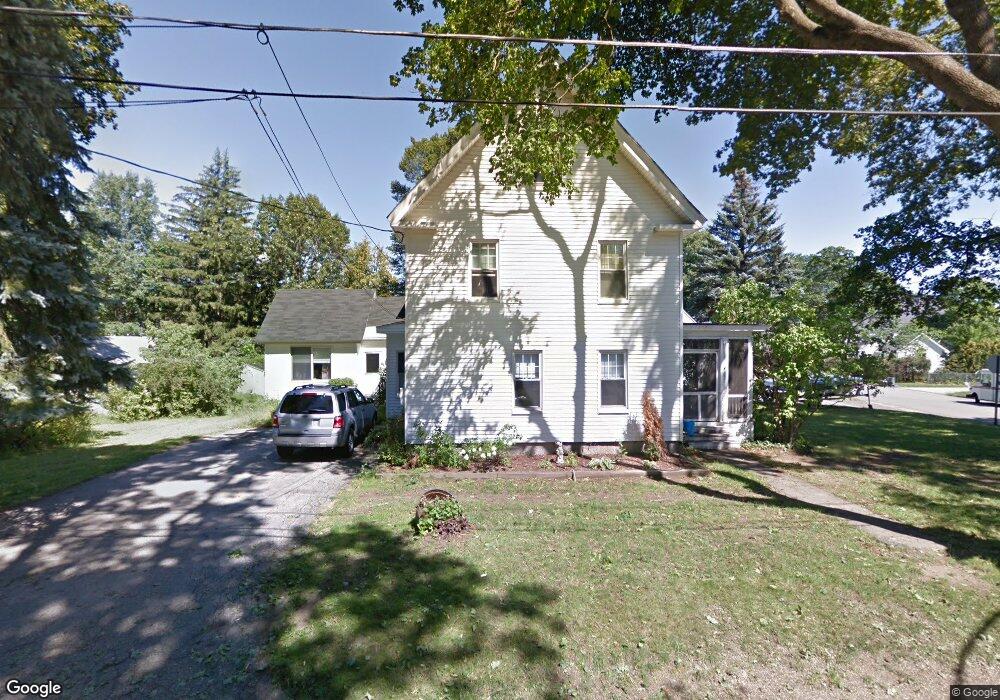
17 Princeton St Concord, NH 03301
South End NeighborhoodEstimated Value: $460,000 - $606,000
4
Beds
2
Baths
2,324
Sq Ft
$227/Sq Ft
Est. Value
About This Home
This home is located at 17 Princeton St, Concord, NH 03301 and is currently estimated at $527,801, approximately $227 per square foot. 17 Princeton St is a home located in Merrimack County with nearby schools including Abbot-Downing School, Rundlett Middle School, and Concord High School.
Ownership History
Date
Name
Owned For
Owner Type
Purchase Details
Closed on
Sep 16, 2022
Sold by
Samson-Bamberger Joann
Bought by
Pappas Charlene M
Current Estimated Value
Home Financials for this Owner
Home Financials are based on the most recent Mortgage that was taken out on this home.
Original Mortgage
$200,000
Outstanding Balance
$190,111
Interest Rate
4.99%
Mortgage Type
Purchase Money Mortgage
Estimated Equity
$337,690
Purchase Details
Closed on
Jan 23, 1991
Bought by
Samson Joann
Create a Home Valuation Report for This Property
The Home Valuation Report is an in-depth analysis detailing your home's value as well as a comparison with similar homes in the area
Home Values in the Area
Average Home Value in this Area
Purchase History
| Date | Buyer | Sale Price | Title Company |
|---|---|---|---|
| Pappas Charlene M | $310,000 | None Available | |
| Samson Joann | -- | -- |
Source: Public Records
Mortgage History
| Date | Status | Borrower | Loan Amount |
|---|---|---|---|
| Open | Pappas Charlene M | $200,000 | |
| Previous Owner | Samson Joann | $183,000 |
Source: Public Records
Tax History Compared to Growth
Tax History
| Year | Tax Paid | Tax Assessment Tax Assessment Total Assessment is a certain percentage of the fair market value that is determined by local assessors to be the total taxable value of land and additions on the property. | Land | Improvement |
|---|---|---|---|---|
| 2024 | $10,063 | $363,400 | $122,100 | $241,300 |
| 2023 | $9,739 | $362,600 | $122,100 | $240,500 |
| 2022 | $9,388 | $362,600 | $122,100 | $240,500 |
| 2021 | $9,093 | $362,000 | $121,500 | $240,500 |
| 2020 | $8,981 | $335,600 | $95,700 | $239,900 |
| 2019 | $8,556 | $308,000 | $99,400 | $208,600 |
| 2018 | $8,350 | $296,200 | $99,700 | $196,500 |
| 2017 | $8,204 | $290,500 | $99,700 | $190,800 |
| 2016 | $7,808 | $282,200 | $97,900 | $184,300 |
| 2015 | $7,354 | $250,900 | $88,500 | $162,400 |
| 2014 | $6,727 | $250,900 | $88,500 | $162,400 |
| 2013 | -- | $250,900 | $88,500 | $162,400 |
| 2012 | -- | $246,800 | $88,500 | $158,300 |
Source: Public Records
Map
Nearby Homes
- 122 South St
- 12 Avon St
- 0 South St Unit 4969509
- 0 Spruce St Unit 88
- 33 Spruce St
- 24 Pierce St
- 47 South St
- 24 Badger St
- 105 S Main St
- 22 Wilson Ave
- 14 Downing St
- 15 Wilson Ave
- 14-16 Perley St
- 10 Perley St
- 87 S Main St Unit 2
- 54 Pleasant St Unit 8
- 4 Fayette St
- 2 Kensington Rd
- 1 Kensington Rd
- 376 S Main St