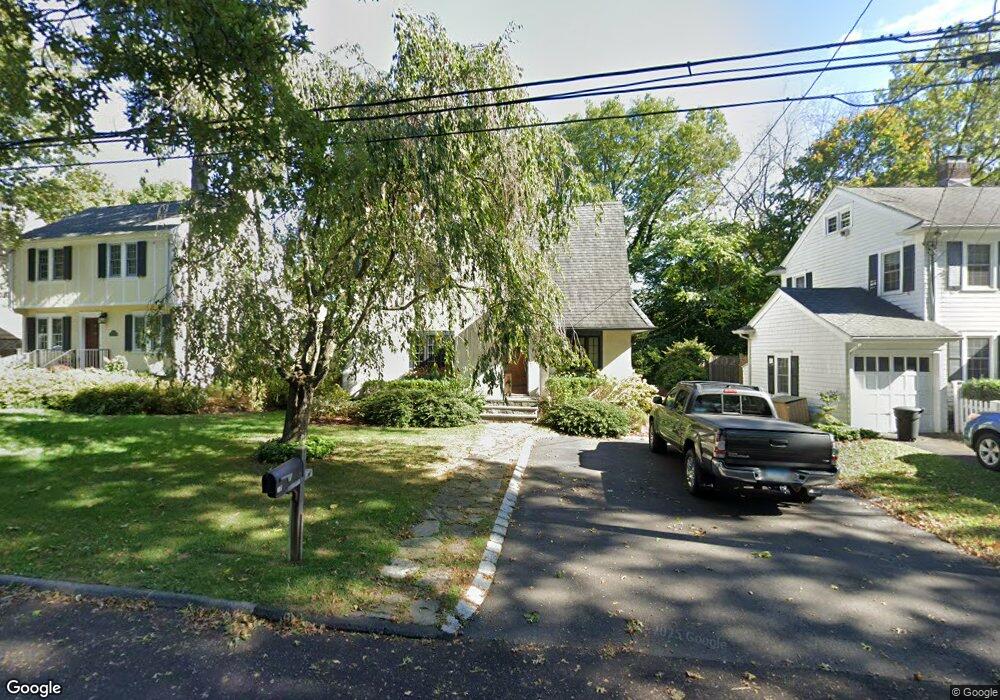
17 Richmond Dr Old Greenwich, CT 06870
Old Greenwich NeighborhoodEstimated Value: $1,395,733 - $1,728,000
3
Beds
2
Baths
1,375
Sq Ft
$1,143/Sq Ft
Est. Value
About This Home
This home is located at 17 Richmond Dr, Old Greenwich, CT 06870 and is currently estimated at $1,572,183, approximately $1,143 per square foot. 17 Richmond Dr is a home located in Fairfield County with nearby schools including International School At Dundee, Eastern Middle School, and Greenwich High School.
Ownership History
Date
Name
Owned For
Owner Type
Purchase Details
Closed on
Jul 11, 2006
Sold by
Bennett David K and Bennett Melissa
Bought by
Bella Michelle M
Current Estimated Value
Home Financials for this Owner
Home Financials are based on the most recent Mortgage that was taken out on this home.
Original Mortgage
$876,000
Outstanding Balance
$511,975
Interest Rate
6.37%
Estimated Equity
$1,060,208
Purchase Details
Closed on
Oct 31, 2000
Sold by
Mackenzie Neil P and Meagher Jane
Bought by
Bennett David K and Bennett Melissa
Purchase Details
Closed on
Mar 6, 1998
Sold by
Batlin Mara-Michelle
Bought by
Mackenzie Neil T and Meagher Jane
Purchase Details
Closed on
Jun 21, 1989
Sold by
Karp David
Bought by
Batlin Mara M
Create a Home Valuation Report for This Property
The Home Valuation Report is an in-depth analysis detailing your home's value as well as a comparison with similar homes in the area
Home Values in the Area
Average Home Value in this Area
Purchase History
| Date | Buyer | Sale Price | Title Company |
|---|---|---|---|
| Bella Michelle M | $1,095,000 | -- | |
| Bennett David K | $647,500 | -- | |
| Mackenzie Neil T | $427,500 | -- | |
| Batlin Mara M | $385,000 | -- |
Source: Public Records
Mortgage History
| Date | Status | Borrower | Loan Amount |
|---|---|---|---|
| Open | Batlin Mara M | $876,000 | |
| Closed | Batlin Mara M | $109,400 | |
| Previous Owner | Batlin Mara M | $518,000 |
Source: Public Records
Tax History Compared to Growth
Tax History
| Year | Tax Paid | Tax Assessment Tax Assessment Total Assessment is a certain percentage of the fair market value that is determined by local assessors to be the total taxable value of land and additions on the property. | Land | Improvement |
|---|---|---|---|---|
| 2025 | $9,003 | $728,420 | $597,310 | $131,110 |
| 2024 | $8,694 | $728,420 | $597,310 | $131,110 |
| 2023 | $8,476 | $728,420 | $597,310 | $131,110 |
| 2022 | $8,399 | $728,420 | $597,310 | $131,110 |
| 2021 | $8,114 | $673,960 | $524,580 | $149,380 |
| 2020 | $8,101 | $673,960 | $524,580 | $149,380 |
| 2019 | $8,182 | $673,960 | $524,510 | $149,450 |
| 2018 | $8,000 | $673,960 | $524,510 | $149,450 |
| 2017 | $8,100 | $673,960 | $524,510 | $149,450 |
| 2016 | $7,972 | $673,960 | $524,510 | $149,450 |
| 2015 | $6,703 | $562,100 | $410,830 | $151,270 |
| 2014 | $6,534 | $562,100 | $410,830 | $151,270 |
Source: Public Records
Map
Nearby Homes
- 20 Center Dr
- 27 Sound Beach Ave
- 18 Sound Beach Ave
- 143 Lockwood Rd
- 1465 E Putnam Ave Unit 525
- 51 Forest Ave Unit 98
- 25 Dialstone Ln
- 25 Hoover Rd
- 23 Silver Beech Rd
- 61 Aberdeen St
- 6 Dorchester Ln
- 45 Sunshine Ave
- 33 Halsey Dr
- 11 Perna Ln
- 119 Hendrie Ave
- 7 Highview Ave
- 8 Park Ave
- 175 West Ave Unit 6
- 22 Summit Rd
- 48 Meyer Place
- 19 Richmond Dr
- 15 Richmond Dr
- 21 Richmond Dr
- 13 Richmond Dr
- 36 Laddins Rock Rd
- 38 Laddins Rock Rd
- 34 Laddins Rock Rd
- 23 Richmond Dr
- 40 Laddins Rock Rd
- 9 Richmond Dr
- 16 Richmond Dr
- 18 Richmond Dr
- 14 Richmond Dr
- 20 Richmond Dr
- 22 Richmond Dr
- 42 Laddins Rock Rd
- 12 Richmond Dr
- 27 Richmond Dr
- 32 Laddins Rock Rd
- 7 Richmond Dr