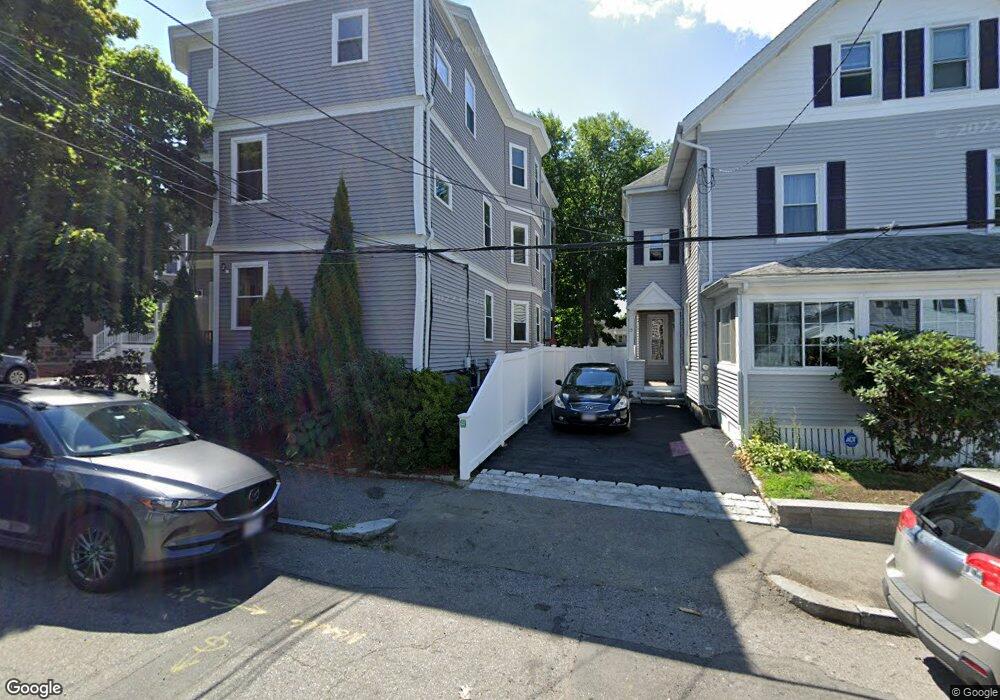
17 Robbins St Unit 5 Waltham, MA 02453
South Side NeighborhoodEstimated Value: $476,964 - $625,000
1
Bed
1
Bath
760
Sq Ft
$726/Sq Ft
Est. Value
About This Home
This home is located at 17 Robbins St Unit 5, Waltham, MA 02453 and is currently estimated at $551,741, approximately $725 per square foot. 17 Robbins St Unit 5 is a home located in Middlesex County with nearby schools including Henry Whittemore Elementary School, John W. Mcdevitt Middle School, and Waltham Sr High School.
Ownership History
Date
Name
Owned For
Owner Type
Purchase Details
Closed on
May 19, 2022
Sold by
Pratt John W
Bought by
Sierra Luis A and Sierra Odalys
Current Estimated Value
Purchase Details
Closed on
Sep 6, 2017
Sold by
Otocka Catherine
Bought by
Catherine Otocka Ret and Otocka
Purchase Details
Closed on
Jan 20, 2015
Sold by
Wincelowicz Zaida
Bought by
Otocka Catherine
Home Financials for this Owner
Home Financials are based on the most recent Mortgage that was taken out on this home.
Original Mortgage
$240,000
Interest Rate
3%
Mortgage Type
New Conventional
Purchase Details
Closed on
Jul 31, 2007
Sold by
Thornton Prop Hldg Llc
Bought by
Wincelowicz Zaida
Home Financials for this Owner
Home Financials are based on the most recent Mortgage that was taken out on this home.
Original Mortgage
$238,500
Interest Rate
6.78%
Mortgage Type
Purchase Money Mortgage
Create a Home Valuation Report for This Property
The Home Valuation Report is an in-depth analysis detailing your home's value as well as a comparison with similar homes in the area
Home Values in the Area
Average Home Value in this Area
Purchase History
| Date | Buyer | Sale Price | Title Company |
|---|---|---|---|
| Sierra Luis A | $505,000 | None Available | |
| Catherine Otocka Ret | -- | -- | |
| Otocka Catherine | $300,000 | -- | |
| Wincelowicz Zaida | $265,000 | -- | |
| Wincelowicz Zaida | $265,000 | -- |
Source: Public Records
Mortgage History
| Date | Status | Borrower | Loan Amount |
|---|---|---|---|
| Previous Owner | Otocka Catherine | $240,000 | |
| Previous Owner | Wincelowicz Zaida | $238,500 | |
| Closed | Sierra Luis A | $0 |
Source: Public Records
Tax History Compared to Growth
Tax History
| Year | Tax Paid | Tax Assessment Tax Assessment Total Assessment is a certain percentage of the fair market value that is determined by local assessors to be the total taxable value of land and additions on the property. | Land | Improvement |
|---|---|---|---|---|
| 2025 | $4,307 | $438,600 | $0 | $438,600 |
| 2024 | $4,386 | $455,000 | $0 | $455,000 |
| 2023 | $4,281 | $414,800 | $0 | $414,800 |
| 2022 | $4,356 | $391,000 | $0 | $391,000 |
| 2021 | $4,467 | $394,600 | $0 | $394,600 |
| 2020 | $4,500 | $376,600 | $0 | $376,600 |
| 2019 | $4,113 | $324,900 | $0 | $324,900 |
| 2018 | $3,769 | $298,900 | $0 | $298,900 |
| 2017 | $3,519 | $280,200 | $0 | $280,200 |
| 2016 | $3,107 | $253,800 | $0 | $253,800 |
| 2015 | $3,025 | $230,400 | $0 | $230,400 |
Source: Public Records
Map
Nearby Homes
- 13 Robbins St Unit 1
- 73 Orange St Unit 2
- 15 Alder St Unit 1
- 31-37 Washington Ave
- 11 Derby St
- 47 Alder St Unit 6
- 85 Crescent St
- 42 Alder St
- 74 Rumford Ave
- 61 Hall St Unit 1
- 61 Hall St Unit 9
- 61 Hall St Unit 2
- 61 Hall St Unit 7
- 55-57 Crescent St
- 81 Alder St
- 24 Tolman St Unit A
- 312 Newton St Unit 1A
- 138 Myrtle St Unit 2
- 101-103 Lexington St
- 39 Floyd St Unit 2
- 17 Robbins St Unit 6
- 17 Robbins St Unit 4
- 17 Robbins St Unit 3
- 17 Robbins St Unit 2
- 17 Robbins St Unit 1
- 17 Robbins St Unit 3-2
- 17 Robbins St Unit 2-1
- 17 Robbins St Unit 2-2
- 17 Robbins St Unit 3-1
- 17 Robbins St Unit 1-1
- 17 Robbins St Unit 1-2
- 19 Robbins St Unit 1-2
- 19 Robbins St Unit 1-1
- 19 Robbins St Unit 10
- 19 Robbins St Unit 9
- 19 Robbins St Unit 8
- 19 Robbins St Unit 7
- 19 Robbins St Unit 1
- 19 Robbins St Unit 32
- 19 Robbins St Unit 3-2