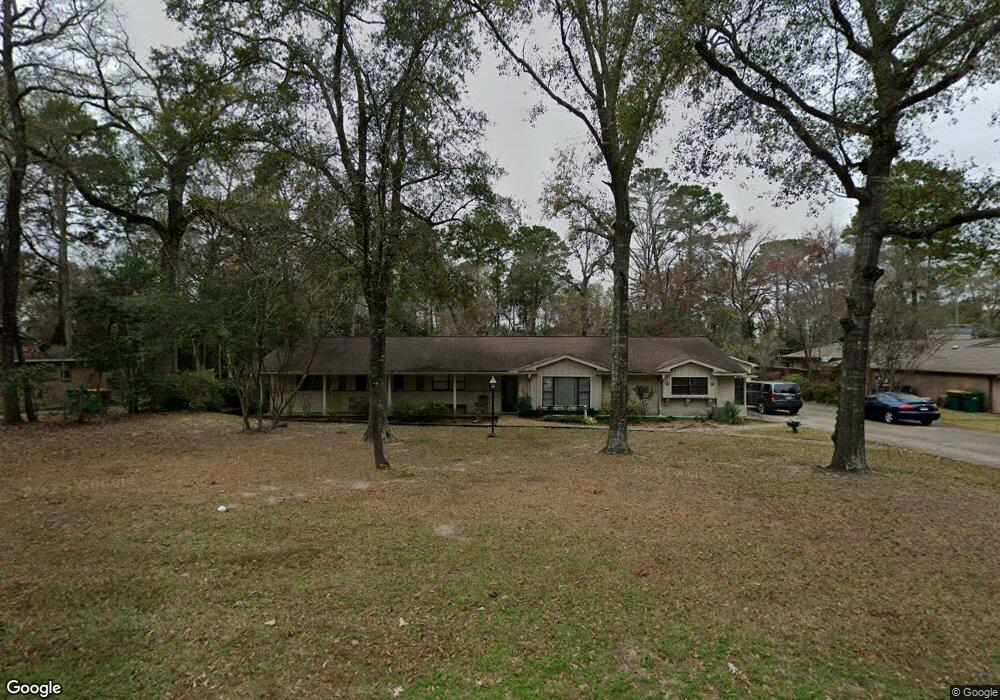
17 Robinhood Dr Conroe, TX 77301
Estimated Value: $277,000 - $328,236
4
Beds
3
Baths
2,476
Sq Ft
$124/Sq Ft
Est. Value
About This Home
This home is located at 17 Robinhood Dr, Conroe, TX 77301 and is currently estimated at $307,309, approximately $124 per square foot. 17 Robinhood Dr is a home located in Montgomery County with nearby schools including Houston Elementary School, Travis Intermediate School, and Peet Junior High School.
Ownership History
Date
Name
Owned For
Owner Type
Purchase Details
Closed on
Nov 30, 2012
Sold by
Fannie Mae
Bought by
Gardezi Summer Birkhead
Current Estimated Value
Home Financials for this Owner
Home Financials are based on the most recent Mortgage that was taken out on this home.
Original Mortgage
$76,000
Outstanding Balance
$52,730
Interest Rate
3.4%
Mortgage Type
New Conventional
Estimated Equity
$254,579
Purchase Details
Closed on
May 1, 2012
Sold by
Johnson Jeffrey Phillip and Peters Mary Kay
Bought by
Federal National Mortgage Association and Fannie Mae
Purchase Details
Closed on
Aug 14, 2006
Sold by
Westbrook Milton Andrew and Westbrook Patricia J
Bought by
Johnson Jeffery Phillip
Home Financials for this Owner
Home Financials are based on the most recent Mortgage that was taken out on this home.
Original Mortgage
$159,650
Interest Rate
6.77%
Mortgage Type
Purchase Money Mortgage
Create a Home Valuation Report for This Property
The Home Valuation Report is an in-depth analysis detailing your home's value as well as a comparison with similar homes in the area
Home Values in the Area
Average Home Value in this Area
Purchase History
| Date | Buyer | Sale Price | Title Company |
|---|---|---|---|
| Gardezi Summer Birkhead | -- | None Available | |
| Federal National Mortgage Association | $164,800 | None Available | |
| Johnson Jeffery Phillip | -- | Stewart Title Of Montgomery |
Source: Public Records
Mortgage History
| Date | Status | Borrower | Loan Amount |
|---|---|---|---|
| Open | Gardezi Summer Birkhead | $76,000 | |
| Previous Owner | Johnson Jeffery Phillip | $159,650 |
Source: Public Records
Tax History Compared to Growth
Tax History
| Year | Tax Paid | Tax Assessment Tax Assessment Total Assessment is a certain percentage of the fair market value that is determined by local assessors to be the total taxable value of land and additions on the property. | Land | Improvement |
|---|---|---|---|---|
| 2025 | $3,876 | $288,167 | $108,510 | $179,657 |
| 2024 | $3,437 | $278,388 | -- | -- |
| 2023 | $3,437 | $253,080 | $108,520 | $188,710 |
| 2022 | $4,772 | $230,070 | $108,520 | $188,940 |
| 2021 | $4,573 | $209,150 | $43,380 | $199,510 |
| 2020 | $4,338 | $190,140 | $43,380 | $203,950 |
| 2019 | $4,031 | $172,850 | $9,110 | $209,150 |
| 2018 | $3,173 | $157,140 | $9,510 | $195,490 |
| 2017 | $3,344 | $142,850 | $9,510 | $223,550 |
| 2016 | $3,040 | $129,860 | $9,510 | $181,820 |
| 2015 | $2,292 | $118,050 | $9,510 | $181,820 |
| 2014 | $2,292 | $105,620 | $9,510 | $96,110 |
Source: Public Records
Map
Nearby Homes
- 1100 Wilson Rd
- 0 W Semands Ave
- 1506 King Ranch Rd
- 2004 White Oak Dr
- 1005 Callahan Ave
- 1015 Stevens Ave
- 1806 N Frazier St
- 1304 & 1306 N Frazier St
- 2002 Willowbend St
- 1107 Holly Dr
- 1620 Odd Fellow St
- 407 W Semands St
- 2030 Plantation Dr Unit B2
- TBD Texas 105
- 405 Shadywood Cir
- 413 Oakhill Dr
- 1907 N Roberson St
- 302 Conroe Dr
- 1020 Houston St
- 1404 N San Jacinto St
- 18 Robinhood Dr
- 19 Robinhood Dr
- 12 Robinhood Dr
- 20 Robinhood Dr
- 20 Little John Ln Unit B
- 20 Little John Ln Unit A
- 7 Little John Ln
- 10 Robinhood Dr
- 11 Robinhood Dr
- 9 Robinhood Dr
- 5 Little John Ln
- 3 Little John Ln
- 16 Little John Ln
- 1 Little John Ln
- 7 Robinhood Dr
- 14 Little John Ln
- 1108 Ferguson St
- 5 Robinhood Dr
- 8 Little John Ln
- 6 Little John Ln