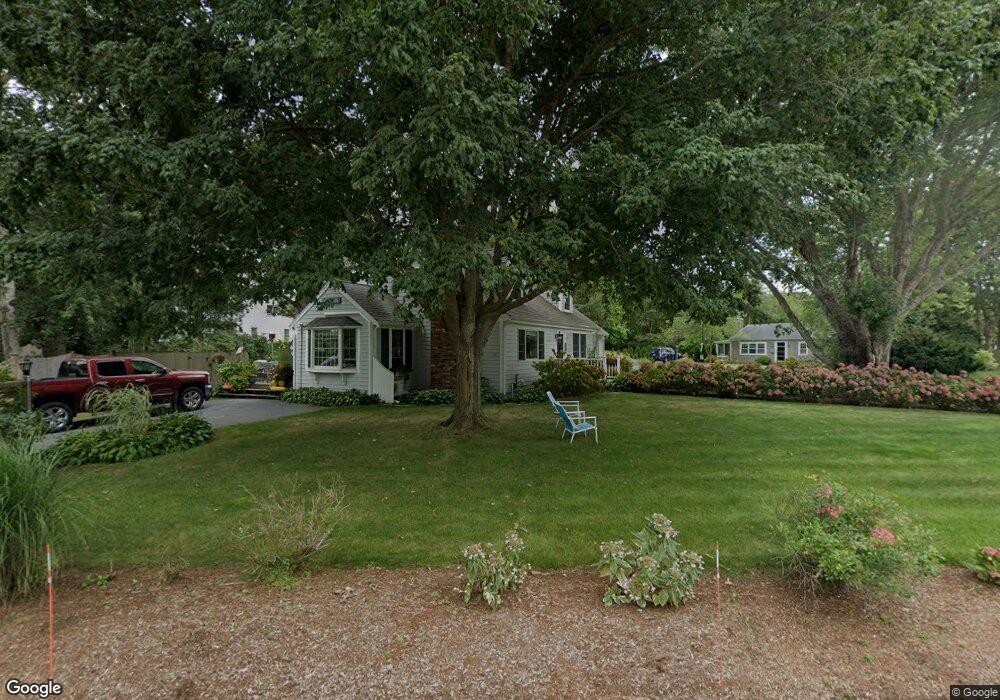
17 Saturn Ln South Yarmouth, MA 02664
Estimated Value: $592,000 - $653,000
4
Beds
2
Baths
1,201
Sq Ft
$513/Sq Ft
Est. Value
About This Home
This home is located at 17 Saturn Ln, South Yarmouth, MA 02664 and is currently estimated at $616,459, approximately $513 per square foot. 17 Saturn Ln is a home located in Barnstable County with nearby schools including Dennis-Yarmouth Regional High School and St. Pius X. School.
Ownership History
Date
Name
Owned For
Owner Type
Purchase Details
Closed on
Feb 15, 2002
Sold by
Ruiz Edwin W
Bought by
Tannozzini Robert and Tannozzini Sandra
Current Estimated Value
Purchase Details
Closed on
May 28, 1999
Sold by
Mitchell Robert A and Mitchell Diann R
Bought by
Ruiz Edwin W and Tetreault Stephen
Home Financials for this Owner
Home Financials are based on the most recent Mortgage that was taken out on this home.
Original Mortgage
$124,936
Interest Rate
6.82%
Mortgage Type
Purchase Money Mortgage
Create a Home Valuation Report for This Property
The Home Valuation Report is an in-depth analysis detailing your home's value as well as a comparison with similar homes in the area
Home Values in the Area
Average Home Value in this Area
Purchase History
| Date | Buyer | Sale Price | Title Company |
|---|---|---|---|
| Tannozzini Robert | $223,000 | -- | |
| Ruiz Edwin W | $125,000 | -- |
Source: Public Records
Mortgage History
| Date | Status | Borrower | Loan Amount |
|---|---|---|---|
| Previous Owner | Ruiz Edwin W | $124,936 |
Source: Public Records
Tax History Compared to Growth
Tax History
| Year | Tax Paid | Tax Assessment Tax Assessment Total Assessment is a certain percentage of the fair market value that is determined by local assessors to be the total taxable value of land and additions on the property. | Land | Improvement |
|---|---|---|---|---|
| 2025 | $3,895 | $550,200 | $180,400 | $369,800 |
| 2024 | $3,573 | $484,200 | $152,500 | $331,700 |
| 2023 | $3,523 | $434,400 | $132,000 | $302,400 |
| 2022 | $3,196 | $348,200 | $120,000 | $228,200 |
| 2021 | $3,044 | $318,400 | $120,000 | $198,400 |
| 2020 | $2,944 | $294,400 | $119,900 | $174,500 |
| 2019 | $2,626 | $260,000 | $119,900 | $140,100 |
| 2018 | $2,493 | $242,300 | $102,200 | $140,100 |
| 2017 | $2,374 | $236,900 | $97,700 | $139,200 |
| 2016 | $2,275 | $228,000 | $88,800 | $139,200 |
| 2015 | $2,174 | $216,500 | $88,800 | $127,700 |
Source: Public Records
Map
Nearby Homes