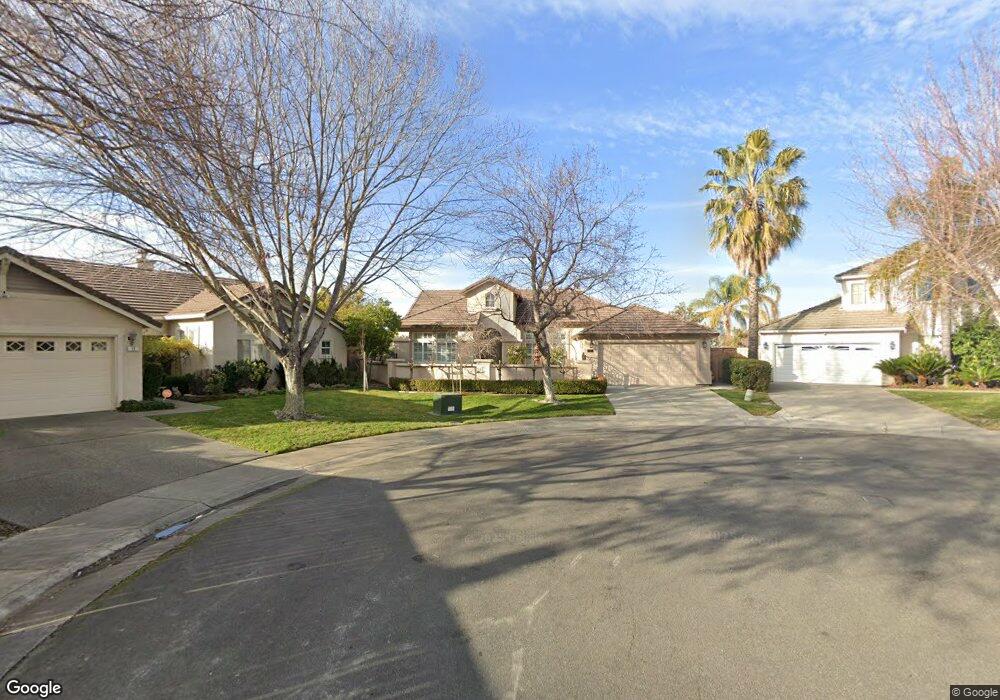
17 Silvershore Ct Sacramento, CA 95834
Sundance Lake NeighborhoodEstimated Value: $603,000 - $793,000
4
Beds
2
Baths
2,405
Sq Ft
$285/Sq Ft
Est. Value
About This Home
This home is located at 17 Silvershore Ct, Sacramento, CA 95834 and is currently estimated at $685,205, approximately $284 per square foot. 17 Silvershore Ct is a home located in Sacramento County with nearby schools including Paso Verde, Inderkum High School, and Natomas Pacific Pathways Prep.
Ownership History
Date
Name
Owned For
Owner Type
Purchase Details
Closed on
Dec 19, 2008
Sold by
Fluegge Bernadine and Bernadine E Fluegge Revocable
Bought by
Livi Fluegge Rebecca and Livi Rebecca Fluegge Revocable
Current Estimated Value
Purchase Details
Closed on
Dec 4, 2007
Sold by
Fluegge Bernadine and Bernadine Fluegge Revocable Li
Bought by
Livi Fluegge Rebecca and Livi Rebecca Fluegge Revocable
Purchase Details
Closed on
Dec 14, 2005
Sold by
Fluegge Bernadine and Bernadine Fluegge Revocable Li
Bought by
Livi Fluegge Rebecca and Livi Rebecca Fluegge Revocable
Purchase Details
Closed on
Oct 4, 2005
Sold by
Fluegge Bernadine
Bought by
Livi Fluegge Rebecca and Livi Rebecca Fluegge Revocable
Purchase Details
Closed on
Oct 14, 2004
Sold by
Fluegge Bernadine
Bought by
Livi Fluegge Rebecca and Livi Rebecca Fluegge Revocable
Purchase Details
Closed on
Jun 13, 2000
Sold by
Sundance Lake Llc
Bought by
Fluegge Bernadine and Fluegge Rebecca Ann
Create a Home Valuation Report for This Property
The Home Valuation Report is an in-depth analysis detailing your home's value as well as a comparison with similar homes in the area
Home Values in the Area
Average Home Value in this Area
Purchase History
| Date | Buyer | Sale Price | Title Company |
|---|---|---|---|
| Livi Fluegge Rebecca | -- | None Available | |
| Livi Fluegge Rebecca | -- | None Available | |
| Livi Fluegge Rebecca | -- | -- | |
| Livi Fluegge Rebecca | -- | -- | |
| Livi Fluegge Rebecca | -- | -- | |
| Livi Fluegge Rebecca A | -- | -- | |
| Flueggw Bernadine | -- | -- | |
| Fluegge Bernadine | $361,500 | First American Title Ins Co |
Source: Public Records
Tax History Compared to Growth
Tax History
| Year | Tax Paid | Tax Assessment Tax Assessment Total Assessment is a certain percentage of the fair market value that is determined by local assessors to be the total taxable value of land and additions on the property. | Land | Improvement |
|---|---|---|---|---|
| 2025 | $8,141 | $572,880 | $153,688 | $419,192 |
| 2024 | $8,141 | $561,648 | $150,675 | $410,973 |
| 2023 | $7,735 | $550,636 | $147,721 | $402,915 |
| 2022 | $7,597 | $539,840 | $144,825 | $395,015 |
| 2021 | $7,646 | $529,256 | $141,986 | $387,270 |
| 2020 | $7,659 | $523,831 | $140,531 | $383,300 |
| 2019 | $7,527 | $513,561 | $137,776 | $375,785 |
| 2018 | $7,254 | $503,492 | $135,075 | $368,417 |
| 2017 | $7,067 | $493,621 | $132,427 | $361,194 |
| 2016 | $7,059 | $483,943 | $129,831 | $354,112 |
| 2015 | $7,156 | $476,674 | $127,881 | $348,793 |
| 2014 | $6,785 | $467,337 | $125,376 | $341,961 |
Source: Public Records
Map
Nearby Homes
- 4916 Brookdale Dr Unit 130
- 4922 Brookdale Dr Unit 128
- 4876 Brookdale Dr Unit 161
- 4901 Gardendell Rd
- 4229 Bouquet Way
- 4224 Floral Dr
- 173 Julia Island Cir
- 4923 Gardendell Rd
- 4216 Brookside Dr
- 29 Windcatcher Ct
- 3604 Sardinia Island Way
- 4 Windcatcher Ct
- 3445 Hornsea Way
- 53 Goose Haven Ct
- 133 Lily Bay Cir
- 4223 Dardanelles St
- 4137 Adriatic Sea Way
- 4111 Windsong St
- 3718 Mirtoon Sea Ave
- 4348 Natomas Central Dr
- 11 Silvershore Ct
- 16 Silvershore Ct
- 10 Silvershore Ct
- 4659 Windsong St
- 4653 Windsong St
- 4665 Windsong St
- 4671 Windsong St
- 4641 Windsong St
- 4677 Windsong St
- 4615 Windsong St
- 4621 Windsong St
- 4609 Windsong St
- 28 Hornbill Ct
- 4627 Windsong St
- 4905 Brookdale Dr Unit 141
- 4907 Brookdale Dr
- 4903 Brookdale Dr Unit 140
- 4903 Brookdale Dr
- 4909 Brookdale Dr
- 4909 Brookdale Dr Unit 143