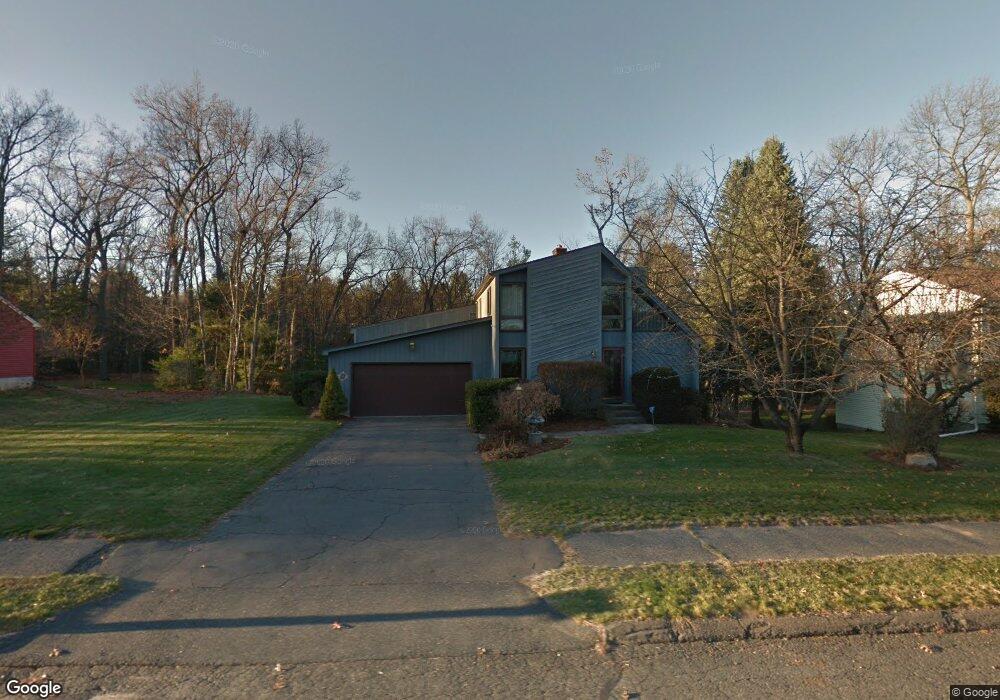
17 Sterling Dr Easthampton, MA 01027
Estimated Value: $576,000 - $594,000
4
Beds
4
Baths
2,163
Sq Ft
$270/Sq Ft
Est. Value
About This Home
This home is located at 17 Sterling Dr, Easthampton, MA 01027 and is currently estimated at $584,465, approximately $270 per square foot. 17 Sterling Dr is a home located in Hampshire County with nearby schools including Easthampton High School, Calvary Baptist Christian School, and Tri-County Schools.
Ownership History
Date
Name
Owned For
Owner Type
Purchase Details
Closed on
May 16, 1997
Sold by
Afnan Jamshid A and Afnan Nazly A
Bought by
Bergeron Gary M and Cormier Kathleen M
Current Estimated Value
Home Financials for this Owner
Home Financials are based on the most recent Mortgage that was taken out on this home.
Original Mortgage
$129,900
Interest Rate
8.12%
Mortgage Type
Purchase Money Mortgage
Create a Home Valuation Report for This Property
The Home Valuation Report is an in-depth analysis detailing your home's value as well as a comparison with similar homes in the area
Home Values in the Area
Average Home Value in this Area
Purchase History
| Date | Buyer | Sale Price | Title Company |
|---|---|---|---|
| Bergeron Gary M | $136,750 | -- |
Source: Public Records
Mortgage History
| Date | Status | Borrower | Loan Amount |
|---|---|---|---|
| Open | Bergeron Gary M | $167,000 | |
| Closed | Bergeron Gary M | $131,900 | |
| Closed | Bergeron Gary M | $129,900 | |
| Previous Owner | Bergeron Gary M | $79,500 |
Source: Public Records
Tax History
| Year | Tax Paid | Tax Assessment Tax Assessment Total Assessment is a certain percentage of the fair market value that is determined by local assessors to be the total taxable value of land and additions on the property. | Land | Improvement |
|---|---|---|---|---|
| 2025 | $7,159 | $523,700 | $130,800 | $392,900 |
| 2024 | $7,038 | $519,000 | $126,900 | $392,100 |
| 2023 | $5,267 | $359,500 | $100,800 | $258,700 |
| 2022 | $5,943 | $359,500 | $100,800 | $258,700 |
| 2021 | $6,549 | $373,400 | $100,800 | $272,600 |
| 2020 | $6,385 | $359,500 | $100,800 | $258,700 |
| 2019 | $5,301 | $342,900 | $100,800 | $242,100 |
| 2018 | $5,126 | $320,400 | $95,000 | $225,400 |
| 2017 | $4,999 | $308,400 | $91,400 | $217,000 |
| 2016 | $4,808 | $308,400 | $91,400 | $217,000 |
| 2015 | $4,672 | $308,400 | $91,400 | $217,000 |
Source: Public Records
Map
Nearby Homes
Your Personal Tour Guide
Ask me questions while you tour the home.