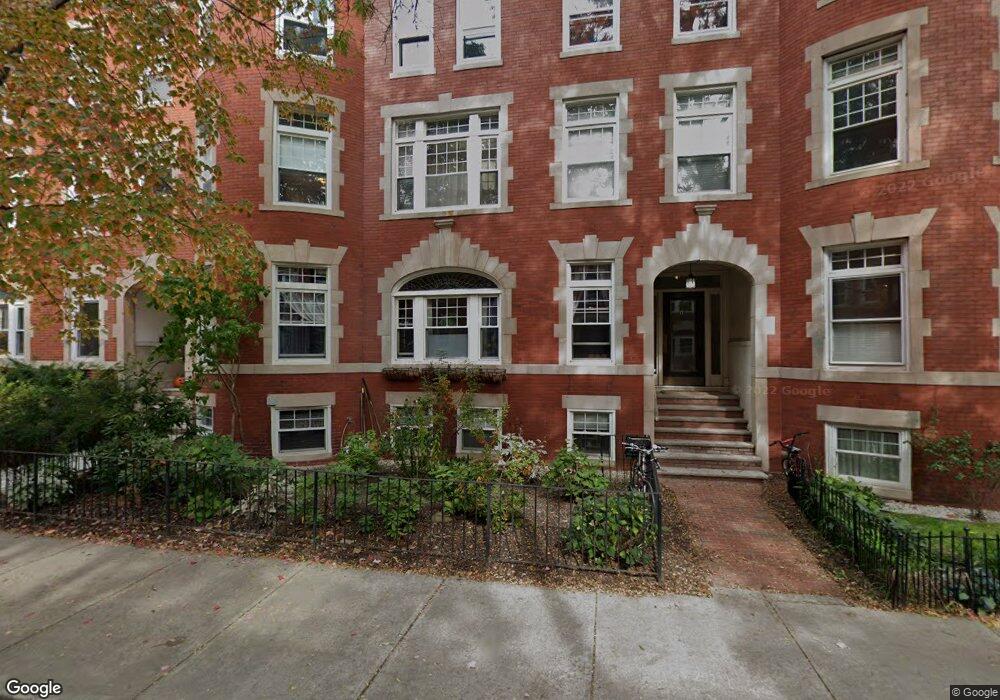
17 Strathmore Rd Unit B Brookline, MA 02445
Cleveland Circle NeighborhoodEstimated Value: $752,000 - $836,000
2
Beds
1
Bath
999
Sq Ft
$795/Sq Ft
Est. Value
About This Home
This home is located at 17 Strathmore Rd Unit B, Brookline, MA 02445 and is currently estimated at $793,818, approximately $794 per square foot. 17 Strathmore Rd Unit B is a home located in Norfolk County with nearby schools including John D. Runkle School, Torah Academy, and Bais Yaakov Of Boston High School.
Ownership History
Date
Name
Owned For
Owner Type
Purchase Details
Closed on
May 31, 2007
Sold by
Duquette John J
Bought by
Shukla Anil and Shukla Sara
Current Estimated Value
Home Financials for this Owner
Home Financials are based on the most recent Mortgage that was taken out on this home.
Original Mortgage
$364,500
Outstanding Balance
$223,639
Interest Rate
6.24%
Mortgage Type
Purchase Money Mortgage
Estimated Equity
$570,179
Purchase Details
Closed on
Dec 23, 2003
Sold by
Lokey Thomas C and Lokey Marilyn M
Bought by
Duquette John J
Home Financials for this Owner
Home Financials are based on the most recent Mortgage that was taken out on this home.
Original Mortgage
$220,000
Interest Rate
5.96%
Mortgage Type
Purchase Money Mortgage
Purchase Details
Closed on
Jul 7, 2000
Sold by
Pst Rlty Llc
Bought by
Lokey Thomas C and Lokey Marilyn M
Home Financials for this Owner
Home Financials are based on the most recent Mortgage that was taken out on this home.
Original Mortgage
$225,000
Interest Rate
8.55%
Mortgage Type
Purchase Money Mortgage
Create a Home Valuation Report for This Property
The Home Valuation Report is an in-depth analysis detailing your home's value as well as a comparison with similar homes in the area
Home Values in the Area
Average Home Value in this Area
Purchase History
| Date | Buyer | Sale Price | Title Company |
|---|---|---|---|
| Shukla Anil | $405,000 | -- | |
| Shukla Anil | $405,000 | -- | |
| Duquette John J | $345,000 | -- | |
| Duquette John J | $345,000 | -- | |
| Lokey Thomas C | $225,000 | -- |
Source: Public Records
Mortgage History
| Date | Status | Borrower | Loan Amount |
|---|---|---|---|
| Open | Shukla Anil | $364,500 | |
| Closed | Lokey Thomas C | $364,500 | |
| Previous Owner | Duquette John J | $220,000 | |
| Previous Owner | Lokey Thomas C | $225,000 |
Source: Public Records
Tax History Compared to Growth
Tax History
| Year | Tax Paid | Tax Assessment Tax Assessment Total Assessment is a certain percentage of the fair market value that is determined by local assessors to be the total taxable value of land and additions on the property. | Land | Improvement |
|---|---|---|---|---|
| 2025 | $7,011 | $710,300 | $0 | $710,300 |
| 2024 | $6,804 | $696,400 | $0 | $696,400 |
| 2023 | $7,112 | $713,300 | $0 | $713,300 |
| 2022 | $7,126 | $699,300 | $0 | $699,300 |
| 2021 | $6,786 | $692,400 | $0 | $692,400 |
| 2020 | $6,479 | $685,600 | $0 | $685,600 |
| 2019 | $6,118 | $652,900 | $0 | $652,900 |
| 2018 | $5,795 | $612,600 | $0 | $612,600 |
| 2017 | $5,604 | $567,200 | $0 | $567,200 |
| 2016 | $5,374 | $515,700 | $0 | $515,700 |
| 2015 | $5,007 | $468,800 | $0 | $468,800 |
| 2014 | $4,616 | $405,300 | $0 | $405,300 |
Source: Public Records
Map
Nearby Homes
- 8 Strathmore Rd Unit G
- 17 Strathmore Rd Unit 2
- 1856 Beacon St Unit 2C
- 1880 Beacon St Unit 6
- 3 Englewood Ave Unit 9
- 37 Englewood Ave Unit 3
- 47 Englewood Ave
- 9 Willard Rd
- 19-21 Orkney Rd
- 38 Kilsyth Rd Unit 21
- 31 Orkney Rd Unit 54
- 1778 Beacon St Unit 302
- 41 Orkney Rd
- 65 Strathmore Rd Unit 49
- 1763 Beacon St Unit A
- 44 Orkney Rd Unit 3
- 140 Kilsyth Rd Unit 8
- 15 Colliston Rd Unit 6
- 24 Selkirk Rd Unit 24-4
- 141 Beaconsfield Rd Unit 6
- 17 Strathmore Rd Unit 3
- 17 Strathmore Rd Unit 1
- 17 Strathmore Rd
- 17 Strathmore Rd Unit three
- 17 Strathmore Rd Unit A
- 19 Strathmore Rd
- 19 Strathmore Rd Unit B
- 15 Strathmore Rd Unit A
- 15 Strathmore Rd Unit 3
- 15 Strathmore Rd Unit 2
- 15 Strathmore Rd Unit B
- 15 Strathmore Rd Unit 323
- 11 Strathmore Rd
- 11 Strathmore Rd Unit 3
- 11 Strathmore Rd
- 11 Strathmore Rd Unit 2
- 21 Strathmore Rd Unit 1
- 21 Strathmore Rd Unit 3
- 21 Strathmore Rd Unit 2
- 23 Strathmore Rd Unit 3