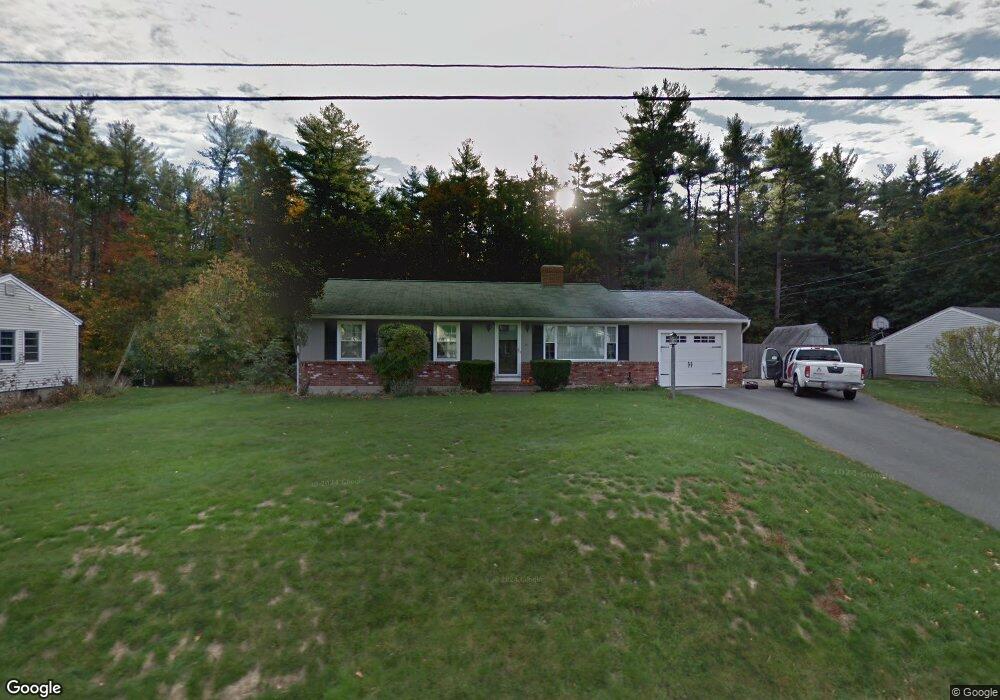
17 Sylvan Rd North Hampton, NH 03862
Estimated Value: $636,385 - $721,000
3
Beds
2
Baths
1,544
Sq Ft
$428/Sq Ft
Est. Value
About This Home
This home is located at 17 Sylvan Rd, North Hampton, NH 03862 and is currently estimated at $660,846, approximately $428 per square foot. 17 Sylvan Rd is a home with nearby schools including North Hampton School, Winnacunnet High School, and Sacred Heart School.
Ownership History
Date
Name
Owned For
Owner Type
Purchase Details
Closed on
Nov 23, 2015
Sold by
Howe Jonathan S
Bought by
Howe Ret and Howe Jonathan S
Current Estimated Value
Purchase Details
Closed on
Sep 7, 2001
Sold by
Taylor Romeo M and Taylor Beverly
Bought by
Howe Elizabeth R and Howe Jonathan S
Home Financials for this Owner
Home Financials are based on the most recent Mortgage that was taken out on this home.
Original Mortgage
$167,000
Interest Rate
7.05%
Create a Home Valuation Report for This Property
The Home Valuation Report is an in-depth analysis detailing your home's value as well as a comparison with similar homes in the area
Home Values in the Area
Average Home Value in this Area
Purchase History
| Date | Buyer | Sale Price | Title Company |
|---|---|---|---|
| Howe Ret | -- | -- | |
| Howe Elizabeth R | $245,000 | -- |
Source: Public Records
Mortgage History
| Date | Status | Borrower | Loan Amount |
|---|---|---|---|
| Previous Owner | Howe Elizabeth R | $129,966 | |
| Previous Owner | Howe Elizabeth R | $167,000 |
Source: Public Records
Tax History
| Year | Tax Paid | Tax Assessment Tax Assessment Total Assessment is a certain percentage of the fair market value that is determined by local assessors to be the total taxable value of land and additions on the property. | Land | Improvement |
|---|---|---|---|---|
| 2024 | $6,235 | $487,100 | $237,500 | $249,600 |
| 2023 | $6,064 | $487,100 | $237,500 | $249,600 |
| 2022 | $6,046 | $352,100 | $174,100 | $178,000 |
| 2021 | $5,834 | $352,100 | $174,100 | $178,000 |
| 2020 | $4,465 | $352,100 | $174,100 | $178,000 |
| 2019 | $5,880 | $352,100 | $174,100 | $178,000 |
| 2018 | $5,718 | $352,100 | $174,100 | $178,000 |
| 2017 | $5,484 | $272,400 | $145,100 | $127,300 |
| 2016 | $6,011 | $272,400 | $145,100 | $127,300 |
| 2015 | $4,762 | $272,400 | $145,100 | $127,300 |
| 2014 | $4,644 | $272,400 | $145,100 | $127,300 |
| 2013 | $4,563 | $272,400 | $145,100 | $127,300 |
Source: Public Records
Map
Nearby Homes
Your Personal Tour Guide
Ask me questions while you tour the home.