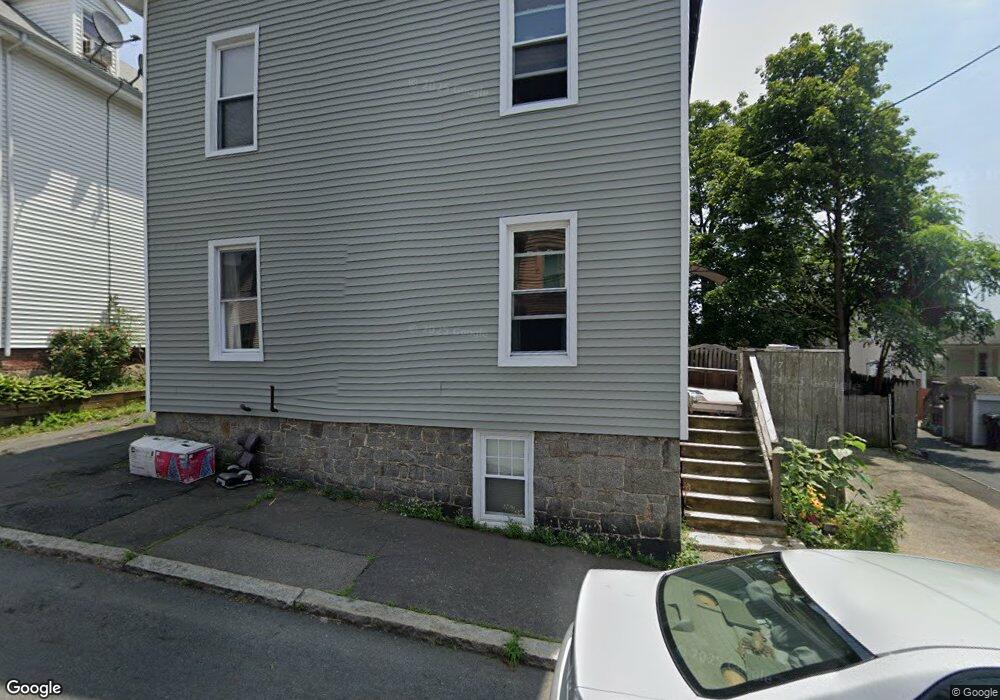
17 Symonds St Salem, MA 01970
North Salem NeighborhoodEstimated Value: $575,000 - $683,605
4
Beds
2
Baths
1,872
Sq Ft
$326/Sq Ft
Est. Value
About This Home
This home is located at 17 Symonds St, Salem, MA 01970 and is currently estimated at $610,901, approximately $326 per square foot. 17 Symonds St is a home located in Essex County with nearby schools including Bates Elementary School, Witchcraft Heights Elementary School, and Saltonstall School.
Ownership History
Date
Name
Owned For
Owner Type
Purchase Details
Closed on
Jun 25, 1992
Sold by
Fed Natl Mtg Assn
Bought by
Markham Jeffrey L
Current Estimated Value
Home Financials for this Owner
Home Financials are based on the most recent Mortgage that was taken out on this home.
Original Mortgage
$87,100
Interest Rate
8.57%
Mortgage Type
Purchase Money Mortgage
Purchase Details
Closed on
Apr 24, 1992
Sold by
Ryan John F
Bought by
Eastern Bank
Create a Home Valuation Report for This Property
The Home Valuation Report is an in-depth analysis detailing your home's value as well as a comparison with similar homes in the area
Home Values in the Area
Average Home Value in this Area
Purchase History
| Date | Buyer | Sale Price | Title Company |
|---|---|---|---|
| Markham Jeffrey L | $91,700 | -- | |
| Eastern Bank | $107,000 | -- |
Source: Public Records
Mortgage History
| Date | Status | Borrower | Loan Amount |
|---|---|---|---|
| Open | Eastern Bank | $127,345 | |
| Closed | Eastern Bank | $87,100 |
Source: Public Records
Tax History Compared to Growth
Tax History
| Year | Tax Paid | Tax Assessment Tax Assessment Total Assessment is a certain percentage of the fair market value that is determined by local assessors to be the total taxable value of land and additions on the property. | Land | Improvement |
|---|---|---|---|---|
| 2025 | $5,549 | $489,300 | $199,100 | $290,200 |
| 2024 | $5,324 | $458,200 | $189,200 | $269,000 |
| 2023 | $5,059 | $404,400 | $174,600 | $229,800 |
| 2022 | $5,394 | $407,100 | $168,800 | $238,300 |
| 2021 | $5,135 | $372,100 | $157,200 | $214,900 |
| 2020 | $5,163 | $357,300 | $148,500 | $208,800 |
| 2019 | $5,114 | $338,700 | $140,900 | $197,800 |
| 2018 | $4,765 | $309,800 | $133,900 | $175,900 |
| 2017 | $4,406 | $277,800 | $112,900 | $164,900 |
| 2016 | $4,272 | $272,600 | $107,700 | $164,900 |
| 2015 | $4,142 | $252,400 | $99,000 | $153,400 |
Source: Public Records
Map
Nearby Homes
- 170 North St
- 27 Appleton St
- 19 Cushing St
- 13 Highland St
- 8 Upham St
- 112 North St
- 97 Mason St Unit 2
- 3 S Mason St
- 14 Margin St
- 41 Dearborn St
- 18 Franklin St Unit 402
- 18 Franklin St Unit 303
- 5 Larchmont Rd Unit 3
- 128 Boston St Unit 4
- 78 Federal St
- 145 Federal St Unit 3
- 145 Boston St
- 35 Flint St Unit 209
- 35 Flint St Unit 106
- 55 Butler St
- 16 Chandler St
- 14 Chandler St
- 15 Symonds St
- 12 Chandler St
- 12 Chandler St Unit 1
- 16 Symonds St
- 14 Symonds St
- 10 Chandler St
- 11 Symonds St
- 11 Symonds St Unit 3
- 11 Symonds St Unit 2
- 18 Symonds St
- 21 Symonds St
- 21 Symonds St Unit 21-2 Symonds St 2,
- 21 Symonds St Unit 2
- 21 Symonds St Unit 1
- 20 Symonds St
- 20 Symonds St Unit 1
- 13 Chandler St
- 12 Symonds St