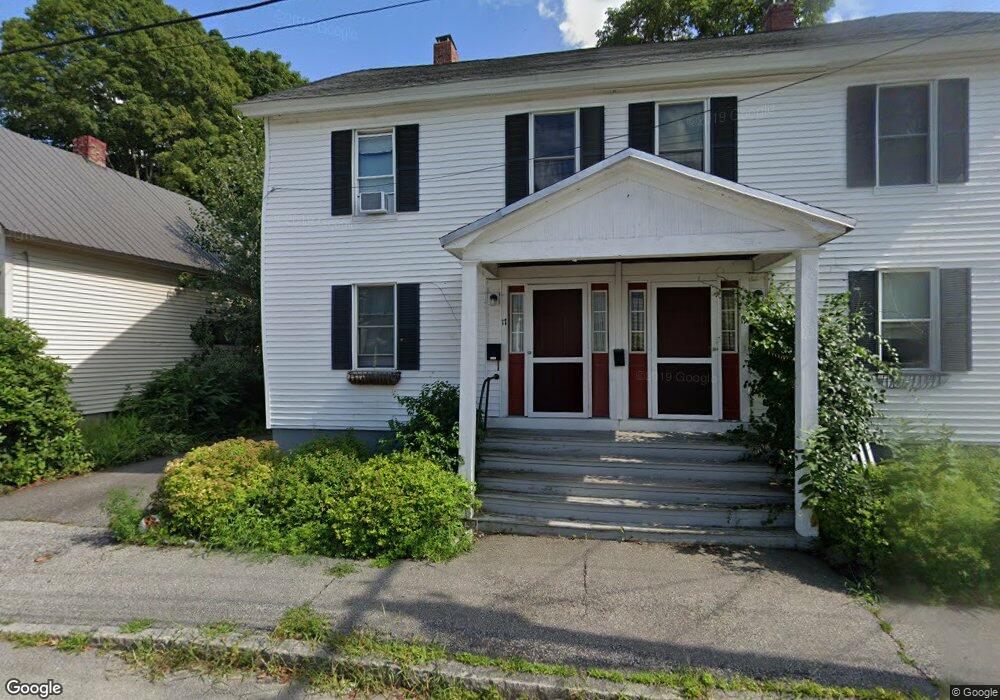
17 Thompson St Unit 19 Concord, NH 03301
South End NeighborhoodEstimated Value: $391,501 - $505,000
4
Beds
2
Baths
2,622
Sq Ft
$175/Sq Ft
Est. Value
About This Home
This home is located at 17 Thompson St Unit 19, Concord, NH 03301 and is currently estimated at $460,125, approximately $175 per square foot. 17 Thompson St Unit 19 is a home located in Merrimack County with nearby schools including Christa McAuliffe School, Rundlett Middle School, and Concord High School.
Ownership History
Date
Name
Owned For
Owner Type
Purchase Details
Closed on
Jul 31, 2007
Sold by
Minery Christopher H and Minery Tania
Bought by
Vincent Teresa K
Current Estimated Value
Home Financials for this Owner
Home Financials are based on the most recent Mortgage that was taken out on this home.
Original Mortgage
$191,900
Interest Rate
6.78%
Mortgage Type
Purchase Money Mortgage
Purchase Details
Closed on
Apr 3, 2002
Sold by
Haywood Todd B and Haywood Cynthia L
Bought by
Minery Christopher H
Home Financials for this Owner
Home Financials are based on the most recent Mortgage that was taken out on this home.
Original Mortgage
$132,050
Interest Rate
6.85%
Mortgage Type
Purchase Money Mortgage
Purchase Details
Closed on
Oct 2, 1998
Sold by
G Deitz Heins Ret
Bought by
Haywood Todd B and Haywood Cynthia L
Home Financials for this Owner
Home Financials are based on the most recent Mortgage that was taken out on this home.
Original Mortgage
$82,750
Interest Rate
6.89%
Mortgage Type
Purchase Money Mortgage
Create a Home Valuation Report for This Property
The Home Valuation Report is an in-depth analysis detailing your home's value as well as a comparison with similar homes in the area
Home Values in the Area
Average Home Value in this Area
Purchase History
| Date | Buyer | Sale Price | Title Company |
|---|---|---|---|
| Vincent Teresa K | $239,900 | -- | |
| Minery Christopher H | $139,000 | -- | |
| Haywood Todd B | $83,000 | -- |
Source: Public Records
Mortgage History
| Date | Status | Borrower | Loan Amount |
|---|---|---|---|
| Open | Haywood Todd B | $196,000 | |
| Closed | Haywood Todd B | $191,900 | |
| Previous Owner | Haywood Todd B | $132,050 | |
| Previous Owner | Haywood Todd B | $82,750 |
Source: Public Records
Tax History Compared to Growth
Tax History
| Year | Tax Paid | Tax Assessment Tax Assessment Total Assessment is a certain percentage of the fair market value that is determined by local assessors to be the total taxable value of land and additions on the property. | Land | Improvement |
|---|---|---|---|---|
| 2024 | $7,274 | $262,700 | $89,500 | $173,200 |
| 2023 | $7,064 | $263,000 | $89,500 | $173,500 |
| 2022 | $6,809 | $263,000 | $89,500 | $173,500 |
| 2021 | $6,604 | $262,900 | $89,400 | $173,500 |
| 2020 | $5,695 | $212,800 | $71,400 | $141,400 |
| 2019 | $5,420 | $195,100 | $66,300 | $128,800 |
| 2018 | $5,601 | $198,700 | $66,300 | $132,400 |
| 2017 | $5,575 | $197,400 | $66,300 | $131,100 |
| 2016 | $5,053 | $182,600 | $66,300 | $116,300 |
| 2015 | $4,604 | $168,400 | $65,000 | $103,400 |
| 2014 | $4,515 | $168,400 | $65,000 | $103,400 |
| 2013 | $4,062 | $158,800 | $65,000 | $93,800 |
| 2012 | $4,048 | $166,100 | $65,000 | $101,100 |
Source: Public Records
Map
Nearby Homes
- 4 Fayette St
- 26 South St
- 10 Perley St
- 47 South St
- 24 Pierce St
- 0 Spruce St Unit 88
- 33 Spruce St
- 122 South St
- 11 Washington St
- 105 S Main St
- 30 Jackson St
- 2 Kensington Rd
- 1 Kensington Rd
- 0 South St Unit 4969509
- 19 Grappone Dr
- 157 Rumford St
- 5 Broad Ave
- 6 Heights Rd
- 7 Highridge Trail
- 69 Manchester St Unit Lot 18