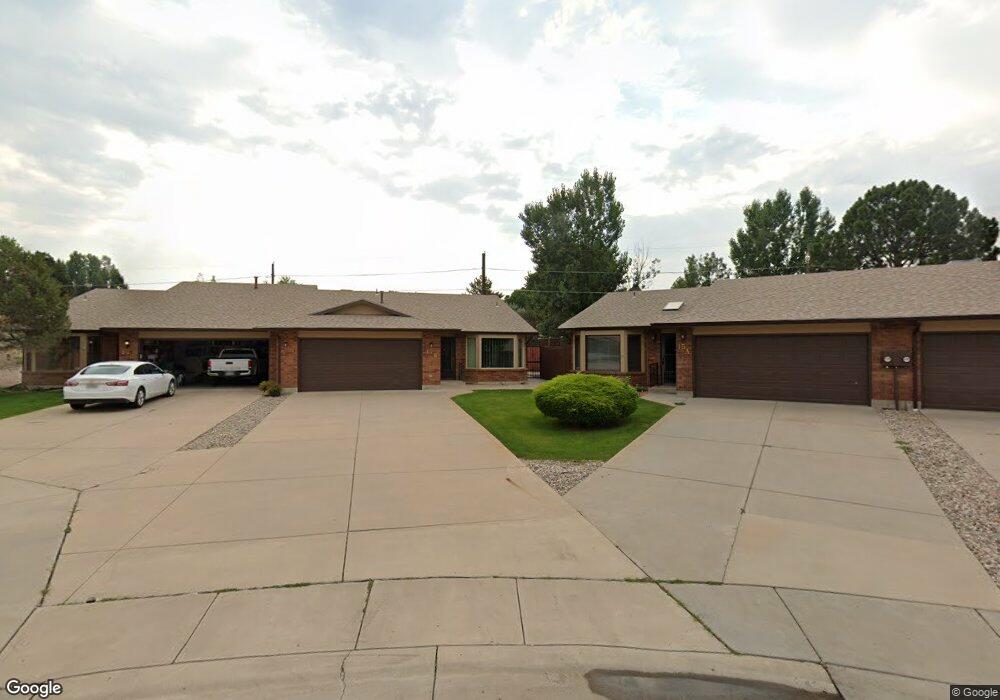
17 Towerbridge Ct Unit B Pueblo, CO 81001
Belmont NeighborhoodEstimated Value: $254,000 - $282,000
2
Beds
2
Baths
1,414
Sq Ft
$188/Sq Ft
Est. Value
About This Home
This home is located at 17 Towerbridge Ct Unit B, Pueblo, CO 81001 and is currently estimated at $265,421, approximately $187 per square foot. 17 Towerbridge Ct Unit B is a home located in Pueblo County with nearby schools including Belmont Elementary School, Heaton Middle School, and East High School.
Ownership History
Date
Name
Owned For
Owner Type
Purchase Details
Closed on
Dec 5, 2016
Sold by
Davis James C and Davis Shirley A
Bought by
Richardson James L
Current Estimated Value
Home Financials for this Owner
Home Financials are based on the most recent Mortgage that was taken out on this home.
Original Mortgage
$105,000
Outstanding Balance
$84,786
Interest Rate
3.52%
Mortgage Type
New Conventional
Estimated Equity
$180,635
Purchase Details
Closed on
Jul 8, 1994
Sold by
Shaffer Stuart J
Bought by
Davis James C + Shirley A
Purchase Details
Closed on
Sep 11, 1992
Sold by
Champion Real Estate Inc
Bought by
Shaffer Stuart J
Purchase Details
Closed on
Jun 28, 1990
Sold by
Ladd John I
Bought by
Champion Real Estate Inc
Purchase Details
Closed on
Jan 29, 1990
Sold by
Ladd John I
Bought by
Ladd John I
Purchase Details
Closed on
Sep 28, 1989
Bought by
Ladd John I
Create a Home Valuation Report for This Property
The Home Valuation Report is an in-depth analysis detailing your home's value as well as a comparison with similar homes in the area
Home Values in the Area
Average Home Value in this Area
Purchase History
| Date | Buyer | Sale Price | Title Company |
|---|---|---|---|
| Richardson James L | $150,000 | Land Title Guarantee Company | |
| Davis James C + Shirley A | $110,000 | -- | |
| Shaffer Stuart J | $105,000 | -- | |
| Champion Real Estate Inc | $120,000 | -- | |
| Ladd John I | -- | -- | |
| Ladd John I | -- | -- |
Source: Public Records
Mortgage History
| Date | Status | Borrower | Loan Amount |
|---|---|---|---|
| Open | Richardson James L | $105,000 |
Source: Public Records
Tax History Compared to Growth
Tax History
| Year | Tax Paid | Tax Assessment Tax Assessment Total Assessment is a certain percentage of the fair market value that is determined by local assessors to be the total taxable value of land and additions on the property. | Land | Improvement |
|---|---|---|---|---|
| 2024 | $1,334 | $13,600 | -- | -- |
| 2023 | $1,350 | $17,290 | $1,010 | $16,280 |
| 2022 | $1,391 | $14,011 | $1,040 | $12,971 |
| 2021 | $1,435 | $14,410 | $1,070 | $13,340 |
| 2020 | $1,210 | $14,410 | $1,070 | $13,340 |
| 2019 | $1,212 | $12,001 | $708 | $11,293 |
| 2018 | $909 | $10,033 | $713 | $9,320 |
| 2017 | $918 | $10,033 | $713 | $9,320 |
| 2016 | $432 | $9,372 | $788 | $8,584 |
| 2015 | $435 | $9,372 | $788 | $8,584 |
| 2014 | $435 | $9,464 | $788 | $8,676 |
Source: Public Records
Map
Nearby Homes
- 6 Crownbridge Ct
- 172 Bonnymede Rd
- 172 Bonnymede Rd Unit A
- 172 Bonnymede Rd Unit C
- 130 Scotland Rd Unit D
- 146 Montebello Rd
- 13 Ironbridge Ln
- 2 Alan Shepard Rd Unit 8
- 55 Bonnymede Rd Unit S
- 55 Bonnymede Rd
- 136 Douglas Ln
- 5 Douglas Ln
- 2 Hilton Ln
- 146 Douglas Ln
- 6 Pineridge Ct
- 39 Apollo Ln
- 62 Louis Nelson Rd
- 36 Scotland Rd
- 59 Villa Dr
- 17 Heaton Place
- 17 Towerbridge Ct Unit A
- 14 Towerbridge Ct
- 15 Towerbridge Ct Unit B
- 15 Towerbridge Ct
- 15 Towerbridge Ct Unit B
- 14 Towerbridge Ct Unit B
- 14 Towerbridge Ct Unit A
- 191 Bonnymede Rd Unit 197
- 191 Bonnymede Rd Unit 191-197 Bonnymede Rd
- 15 Towerbridge Ct
- 199 Bonnymede Rd Unit 205
- 199 Bonnymede Rd Unit 199-205 Bonnymede Rd
- 183 Bonnymede Rd
- 11 Crownbridge Ct
- 207 Bonnymede Rd Unit 213
- 11 Towerbridge Ct Unit A
- 11 Towerbridge Ct Unit B
- 12 Towerbridge Ct Unit A
- 12 Towerbridge Ct Unit B
- 175 Bonnymede Rd