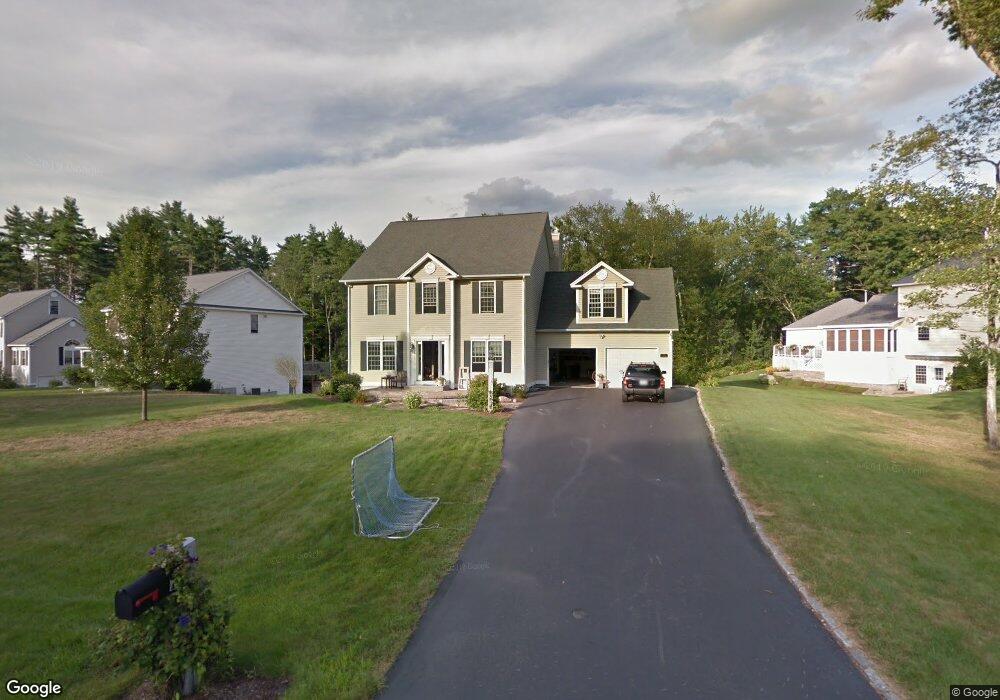
17 Tumble Rd Bedford, NH 03110
Bedford NeighborhoodEstimated Value: $924,000 - $1,035,254
4
Beds
3
Baths
2,972
Sq Ft
$336/Sq Ft
Est. Value
About This Home
This home is located at 17 Tumble Rd, Bedford, NH 03110 and is currently estimated at $999,564, approximately $336 per square foot. 17 Tumble Rd is a home located in Hillsborough County with nearby schools including Mckelvie Intermediate School, Ross A. Lurgio Middle School, and Bedford High School.
Ownership History
Date
Name
Owned For
Owner Type
Purchase Details
Closed on
Mar 14, 2019
Sold by
Manni Nicole
Bought by
Nicole Manni Ret
Current Estimated Value
Purchase Details
Closed on
Dec 9, 2002
Sold by
Dac Invst Corp
Bought by
Manni Michael A and Manni Nicole R
Home Financials for this Owner
Home Financials are based on the most recent Mortgage that was taken out on this home.
Original Mortgage
$272,268
Interest Rate
6.34%
Create a Home Valuation Report for This Property
The Home Valuation Report is an in-depth analysis detailing your home's value as well as a comparison with similar homes in the area
Home Values in the Area
Average Home Value in this Area
Purchase History
| Date | Buyer | Sale Price | Title Company |
|---|---|---|---|
| Nicole Manni Ret | -- | -- | |
| Manni Nicole | -- | -- | |
| Manni Michael A | $367,300 | -- |
Source: Public Records
Mortgage History
| Date | Status | Borrower | Loan Amount |
|---|---|---|---|
| Previous Owner | Manni Michael A | $148,000 | |
| Previous Owner | Manni Michael A | $272,268 |
Source: Public Records
Tax History Compared to Growth
Tax History
| Year | Tax Paid | Tax Assessment Tax Assessment Total Assessment is a certain percentage of the fair market value that is determined by local assessors to be the total taxable value of land and additions on the property. | Land | Improvement |
|---|---|---|---|---|
| 2024 | $14,967 | $946,700 | $315,400 | $631,300 |
| 2023 | $4,700 | $317,600 | $315,400 | $2,200 |
| 2022 | $10,562 | $600,100 | $233,500 | $366,600 |
| 2021 | $10,286 | $600,100 | $233,500 | $366,600 |
| 2020 | $10,270 | $513,000 | $185,900 | $327,100 |
| 2019 | $9,721 | $513,000 | $185,900 | $327,100 |
| 2018 | $9,759 | $478,400 | $185,900 | $292,500 |
| 2017 | $9,047 | $478,400 | $185,900 | $292,500 |
| 2016 | $8,422 | $376,500 | $104,000 | $272,500 |
| 2015 | $8,569 | $376,500 | $104,000 | $272,500 |
| 2014 | $8,471 | $376,500 | $104,000 | $272,500 |
| 2013 | $8,347 | $376,500 | $104,000 | $272,500 |
Source: Public Records
Map
Nearby Homes
- 56 Greenfield Pkwy
- 36 Summit Rd
- 32 Summit Rd
- 21 Adams Green
- 40 Seton Dr
- 217 Liberty Hill Rd
- 150 Wallace Rd
- 155 Wallace Rd
- 14 Veronica Dr
- 6 Boulder Way
- 38 Christmas Tree Cir
- 44 McQuade Brook Rd
- 7 Hamilton Way
- 7 Shepherd Hill Rd
- 20 Ledgewood Rd
- 80 Wire Rd
- 10 Roosevelt Dr
- 115 Back River Rd
- 4 Jenkins Rd Unit Lot 31-4 - The Hann
- 11 Weymouth Dr