17 Uplands Way Glastonbury, CT 06033
East Glastonbury NeighborhoodEstimated Value: $372,000 - $396,000
2
Beds
3
Baths
1,423
Sq Ft
$270/Sq Ft
Est. Value
About This Home
This home is located at 17 Uplands Way, Glastonbury, CT 06033 and is currently estimated at $384,438, approximately $270 per square foot. 17 Uplands Way is a home located in Hartford County with nearby schools including Hopewell School, Gideon Welles School, and Smith Middle School.
Ownership History
Date
Name
Owned For
Owner Type
Purchase Details
Closed on
Dec 11, 2013
Sold by
Graves Maureen D
Bought by
Baran Mary E and Curtis Terry D
Current Estimated Value
Home Financials for this Owner
Home Financials are based on the most recent Mortgage that was taken out on this home.
Original Mortgage
$140,000
Outstanding Balance
$103,710
Interest Rate
4.14%
Mortgage Type
New Conventional
Estimated Equity
$280,728
Purchase Details
Closed on
Jun 18, 2010
Sold by
Smialkowski Ludwik and Smialkowski Krystyna
Bought by
Graves Maureen D
Purchase Details
Closed on
Jan 31, 2003
Sold by
Frisbee Rhonda M
Bought by
Smialkowski Ludwik and Smialkowski Krystyna
Purchase Details
Closed on
Jan 12, 1998
Sold by
Brennan Jean M
Bought by
Frisbee Rhonda M
Purchase Details
Closed on
Apr 15, 1994
Sold by
Abell Peter L
Bought by
Brennan Jean M
Purchase Details
Closed on
Jun 1, 1987
Sold by
J H Scelza Inc
Bought by
Abell Peter L
Create a Home Valuation Report for This Property
The Home Valuation Report is an in-depth analysis detailing your home's value as well as a comparison with similar homes in the area
Home Values in the Area
Average Home Value in this Area
Purchase History
| Date | Buyer | Sale Price | Title Company |
|---|---|---|---|
| Baran Mary E | $220,000 | -- | |
| Baran Mary E | $220,000 | -- | |
| Graves Maureen D | $223,000 | -- | |
| Graves Maureen D | $223,000 | -- | |
| Smialkowski Ludwik | $940,000 | -- | |
| Smialkowski Ludwik | $940,000 | -- | |
| Frisbee Rhonda M | $127,500 | -- | |
| Frisbee Rhonda M | $127,500 | -- | |
| Brennan Jean M | $120,000 | -- | |
| Brennan Jean M | $120,000 | -- | |
| Abell Peter L | $146,400 | -- |
Source: Public Records
Mortgage History
| Date | Status | Borrower | Loan Amount |
|---|---|---|---|
| Open | Abell Peter L | $140,000 | |
| Closed | Abell Peter L | $140,000 |
Source: Public Records
Tax History Compared to Growth
Tax History
| Year | Tax Paid | Tax Assessment Tax Assessment Total Assessment is a certain percentage of the fair market value that is determined by local assessors to be the total taxable value of land and additions on the property. | Land | Improvement |
|---|---|---|---|---|
| 2025 | $5,391 | $164,200 | $0 | $164,200 |
| 2024 | $5,243 | $164,200 | $0 | $164,200 |
| 2023 | $5,092 | $164,200 | $0 | $164,200 |
| 2022 | $5,211 | $139,700 | $0 | $139,700 |
| 2021 | $5,214 | $139,700 | $0 | $139,700 |
| 2020 | $5,155 | $139,700 | $0 | $139,700 |
| 2019 | $5,079 | $139,700 | $0 | $139,700 |
| 2018 | $5,029 | $139,700 | $0 | $139,700 |
| 2017 | $5,059 | $135,100 | $0 | $135,100 |
| 2016 | $4,918 | $135,100 | $0 | $135,100 |
| 2015 | $4,877 | $135,100 | $0 | $135,100 |
| 2014 | $4,816 | $135,100 | $0 | $135,100 |
Source: Public Records
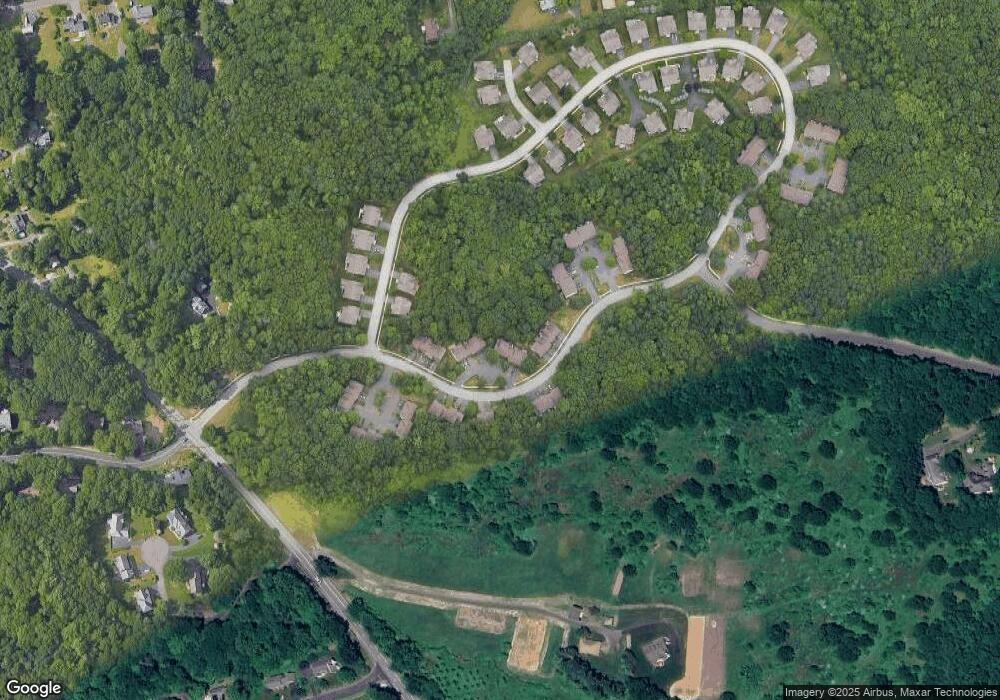
Map
Nearby Homes
- 1 Uplands Way Unit 1
- 17 Autumn Ln
- 192 Conestoga Way Unit 192
- 179 Rampart Dr
- 47 Conestoga Way Unit 47
- 26 Conestoga Way
- 474 Neipsic Rd
- 38 Conestoga Way
- 89 Goodrich Rd
- 76 Trymbulak Ln
- 297 Wickham Rd
- 23 Wagon Rd
- 318 Three Mile Rd
- 228 Georgetown Dr
- 8 Chelsea Rd Unit 8
- 49 Millstone Rd
- 1043 Hopewell Rd
- 8 Copley Rd Unit 8
- 10 Rockhaven Dr Unit 10
- 97 Crosby Rd
- 17 Uplands Way Unit 17
- 19 Uplands Way
- 21 Uplands Way
- 21 Uplands Way Unit 21
- 15 Uplands Way
- 15 Uplands Way Unit 15
- 23 Uplands Way
- 23 Uplands Way Unit 23
- 13 Uplands Way
- 11 Uplands Way
- 25 Uplands Way
- 9 Uplands Way
- 9 Uplands Way Unit 9
- 27 Uplands Way
- 44 Uplands Way
- 44 Uplands Way Unit 44
- 29 Uplands Way
- 42 Uplands Way
- 42 Uplands Way Unit 42
- 31 Uplands Way