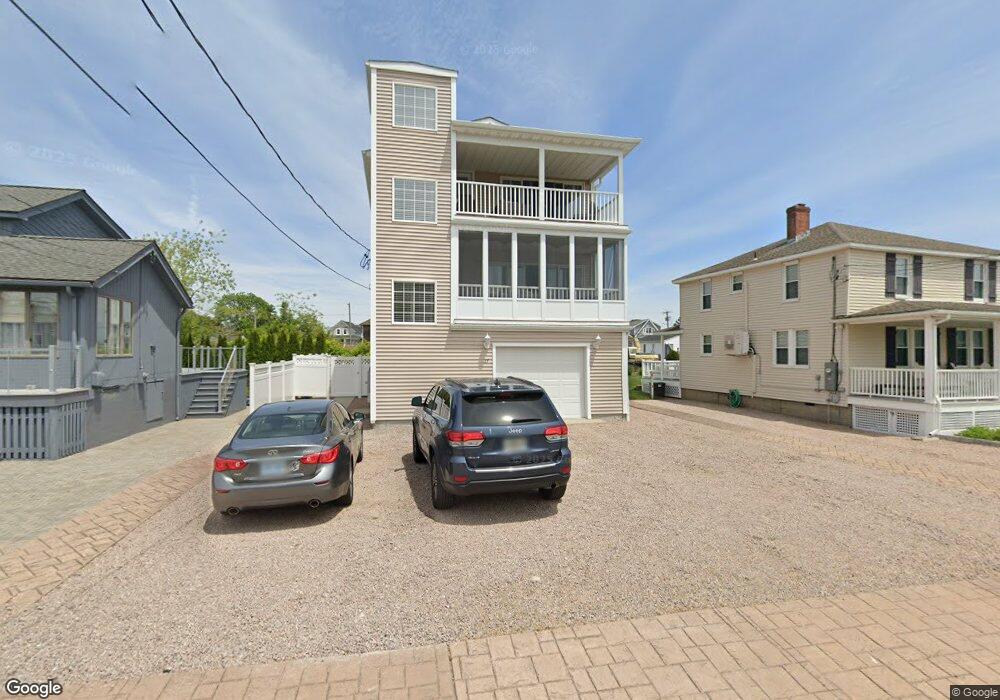
17 Uzzi Ave Westerly, RI 02891
Estimated Value: $1,041,000 - $1,246,000
2
Beds
3
Baths
1,520
Sq Ft
$772/Sq Ft
Est. Value
About This Home
This home is located at 17 Uzzi Ave, Westerly, RI 02891 and is currently estimated at $1,173,072, approximately $771 per square foot. 17 Uzzi Ave is a home located in Washington County with nearby schools including Westerly High School.
Ownership History
Date
Name
Owned For
Owner Type
Purchase Details
Closed on
Jul 14, 2021
Sold by
Mylinda S Scott Ret
Bought by
Calandra Christopher J and Calandra Joelle
Current Estimated Value
Purchase Details
Closed on
Jun 4, 2021
Sold by
Scott Gilbert C and Scott Mylinda S
Bought by
Mylinda S Scott Ret
Purchase Details
Closed on
Aug 23, 2019
Sold by
Scott Gilbert C and Scott Mylinda S
Bought by
Mylinda S Scott Ret
Purchase Details
Closed on
Feb 27, 2009
Sold by
Sorensen & Mccuin Con Ll
Bought by
Scott Gilbert C and Scott Mylinda S
Home Financials for this Owner
Home Financials are based on the most recent Mortgage that was taken out on this home.
Original Mortgage
$280,000
Interest Rate
5%
Mortgage Type
Purchase Money Mortgage
Create a Home Valuation Report for This Property
The Home Valuation Report is an in-depth analysis detailing your home's value as well as a comparison with similar homes in the area
Home Values in the Area
Average Home Value in this Area
Purchase History
| Date | Buyer | Sale Price | Title Company |
|---|---|---|---|
| Calandra Christopher J | $800,000 | None Available | |
| Mylinda S Scott Ret | -- | None Available | |
| Mylinda S Scott Ret | -- | -- | |
| Scott Gilbert C | $560,000 | -- |
Source: Public Records
Mortgage History
| Date | Status | Borrower | Loan Amount |
|---|---|---|---|
| Previous Owner | Scott Gilbert C | $225,000 | |
| Previous Owner | Scott Gilbert C | $280,000 | |
| Previous Owner | Scott Gilbert C | $550,000 |
Source: Public Records
Tax History
| Year | Tax Paid | Tax Assessment Tax Assessment Total Assessment is a certain percentage of the fair market value that is determined by local assessors to be the total taxable value of land and additions on the property. | Land | Improvement |
|---|---|---|---|---|
| 2025 | $7,978 | $1,122,100 | $761,100 | $361,000 |
| 2024 | $8,174 | $833,200 | $543,700 | $289,500 |
| 2023 | $8,015 | $833,200 | $543,700 | $289,500 |
| 2022 | $7,965 | $833,200 | $543,700 | $289,500 |
| 2021 | $6,573 | $570,600 | $341,500 | $229,100 |
| 2020 | $6,453 | $570,600 | $341,500 | $229,100 |
| 2019 | $6,391 | $570,600 | $341,500 | $229,100 |
| 2018 | $6,258 | $526,800 | $324,000 | $202,800 |
| 2017 | $6,106 | $526,800 | $324,000 | $202,800 |
| 2016 | $6,153 | $526,800 | $324,000 | $202,800 |
| 2015 | $5,850 | $540,700 | $330,500 | $210,200 |
| 2014 | $5,753 | $540,700 | $330,500 | $210,200 |
Source: Public Records
Map
Nearby Homes
- 27 Benson Ave
- 10 Tristam St
- 4 Shore Rd
- 4 Quail Run
- 9 Compass Way Unit 201
- 9 Compass Way Unit 202
- 9 Compass Way Unit 101
- 9 Compass Way Unit 102
- 9 Compass Way Unit 103
- 9 Compass Way Unit 203
- 109 Watch Hill Rd
- 20 Browning Rd
- 52 Avondale Rd
- 60 Avondale Rd
- 9 Champlin Dr
- 417 River Rd
- 18 Timothy Dr
- 432 Atlantic Ave
- 446 Atlantic Ave
- 16 Green Ave
Your Personal Tour Guide
Ask me questions while you tour the home.