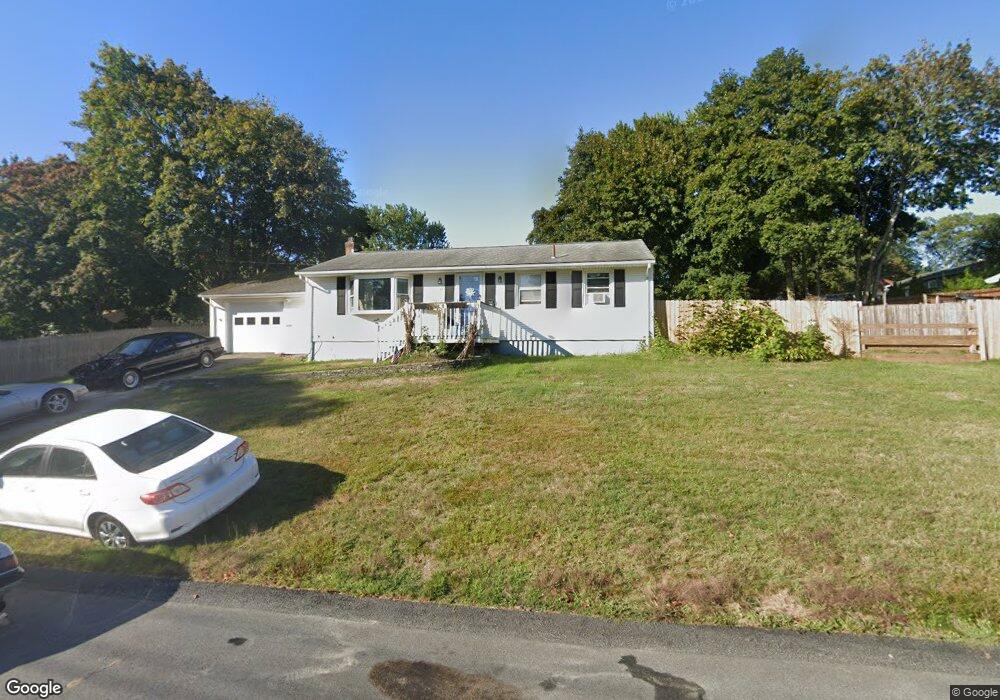
17 Viceroy Rd Warwick, RI 02886
Cowesett Neighborhood
3
Beds
1
Bath
1,144
Sq Ft
11,326
Sq Ft Lot
About This Home
This home is located at 17 Viceroy Rd, Warwick, RI 02886. 17 Viceroy Rd is a home located in Kent County with nearby schools including St Rose Of Lima School.
Create a Home Valuation Report for This Property
The Home Valuation Report is an in-depth analysis detailing your home's value as well as a comparison with similar homes in the area
Home Values in the Area
Average Home Value in this Area
Tax History
| Year | Tax Paid | Tax Assessment Tax Assessment Total Assessment is a certain percentage of the fair market value that is determined by local assessors to be the total taxable value of land and additions on the property. | Land | Improvement |
|---|---|---|---|---|
| 2024 | $3,178 | $219,600 | $82,300 | $137,300 |
| 2023 | $3,116 | $219,600 | $82,300 | $137,300 |
| 2022 | $4,113 | $219,600 | $82,300 | $137,300 |
| 2021 | $4,113 | $219,600 | $82,300 | $137,300 |
| 2020 | $4,113 | $219,600 | $82,300 | $137,300 |
| 2019 | $4,113 | $219,600 | $82,300 | $137,300 |
| 2018 | $3,638 | $174,900 | $82,300 | $92,600 |
| 2017 | $3,540 | $174,900 | $82,300 | $92,600 |
| 2016 | $3,540 | $174,900 | $82,300 | $92,600 |
| 2015 | $3,592 | $173,100 | $76,700 | $96,400 |
| 2014 | $3,472 | $173,100 | $76,700 | $96,400 |
| 2013 | $3,426 | $173,100 | $76,700 | $96,400 |
Source: Public Records
Map
Nearby Homes
- 151 Drum Rock Ave
- 52 Benefit St
- 155 Birkshire Dr
- 3399 Post Rd Unit 15
- 10 Arrowhead Way
- 48 Patrick Way
- 170 Cowesett Rd
- 123 Cowesett Rd
- 146 Edmond Dr
- 52 Bruce Ln
- 3800 Post Rd Unit 4
- 6 Contour Rd
- 84 Spruce St
- 36 Great Oak Dr
- 27 Great Oak Dr
- 6 Island View Dr
- 43 Highland Ave
- 139 Lancaster Ave
- 3940 Post Rd Unit 26
- 3940 Post Rd Unit 3
Your Personal Tour Guide
Ask me questions while you tour the home.