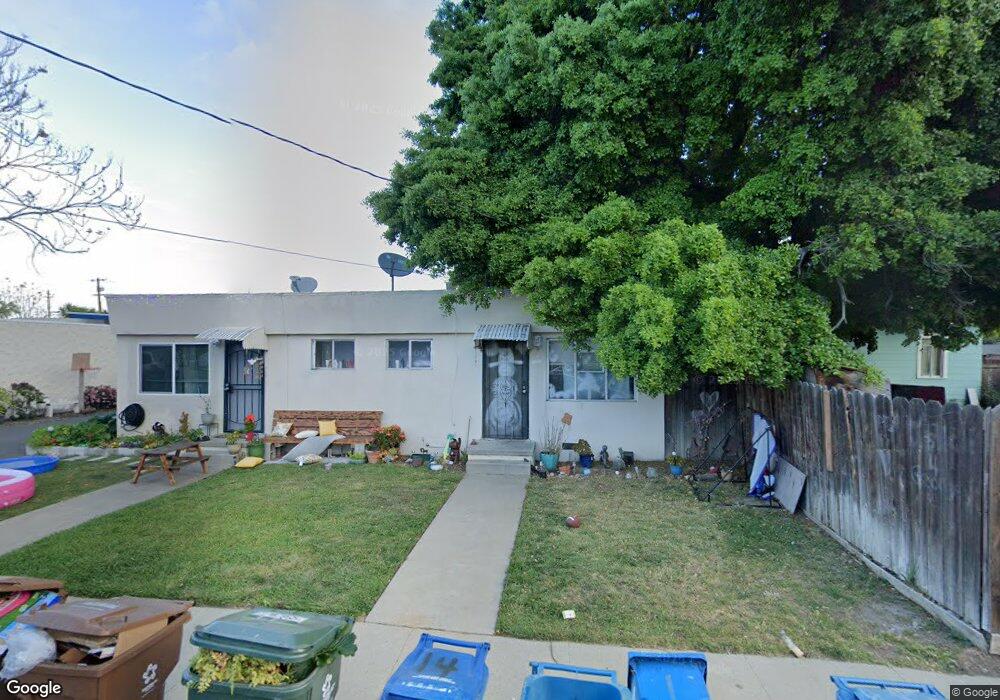
17 W 11th St Antioch, CA 94509
North Antioch NeighborhoodEstimated Value: $381,000 - $464,000
2
Beds
2
Baths
940
Sq Ft
$445/Sq Ft
Est. Value
About This Home
This home is located at 17 W 11th St, Antioch, CA 94509 and is currently estimated at $418,690, approximately $445 per square foot. 17 W 11th St is a home with nearby schools including Fremont Elementary School, Antioch Middle School, and Antioch High School.
Ownership History
Date
Name
Owned For
Owner Type
Purchase Details
Closed on
May 12, 2004
Sold by
Wagner Alen and Wagner Gina
Bought by
Davidson Kevin and Davidson Karen
Current Estimated Value
Purchase Details
Closed on
May 3, 2004
Sold by
Spooner Francine G
Bought by
Wagner Alen and Wagner Gina
Purchase Details
Closed on
Dec 29, 2003
Sold by
Spooner Francine G
Bought by
Wagner Allen S
Purchase Details
Closed on
Dec 27, 2000
Sold by
Spooner John H and Spooner Francine G
Bought by
Spooner John H and Spooner Francine
Create a Home Valuation Report for This Property
The Home Valuation Report is an in-depth analysis detailing your home's value as well as a comparison with similar homes in the area
Home Values in the Area
Average Home Value in this Area
Purchase History
| Date | Buyer | Sale Price | Title Company |
|---|---|---|---|
| Davidson Kevin | -- | Commonwealth Title | |
| Wagner Alen | -- | -- | |
| Wagner Allen S | -- | -- | |
| Spooner John H | -- | -- |
Source: Public Records
Tax History
| Year | Tax Paid | Tax Assessment Tax Assessment Total Assessment is a certain percentage of the fair market value that is determined by local assessors to be the total taxable value of land and additions on the property. | Land | Improvement |
|---|---|---|---|---|
| 2025 | $4,216 | $277,054 | $159,920 | $117,134 |
| 2024 | $3,958 | $271,623 | $156,785 | $114,838 |
| 2023 | $3,958 | $266,298 | $153,711 | $112,587 |
| 2022 | $3,906 | $261,078 | $150,698 | $110,380 |
| 2021 | $3,753 | $255,960 | $147,744 | $108,216 |
| 2019 | $3,667 | $248,370 | $143,363 | $105,007 |
| 2018 | $3,536 | $243,501 | $140,552 | $102,949 |
| 2017 | $3,435 | $238,728 | $137,797 | $100,931 |
| 2016 | $3,341 | $234,048 | $135,096 | $98,952 |
| 2015 | -- | $200,000 | $115,400 | $84,600 |
| 2014 | $2,614 | $175,000 | $80,000 | $95,000 |
Source: Public Records
Map
Nearby Homes
Your Personal Tour Guide
Ask me questions while you tour the home.