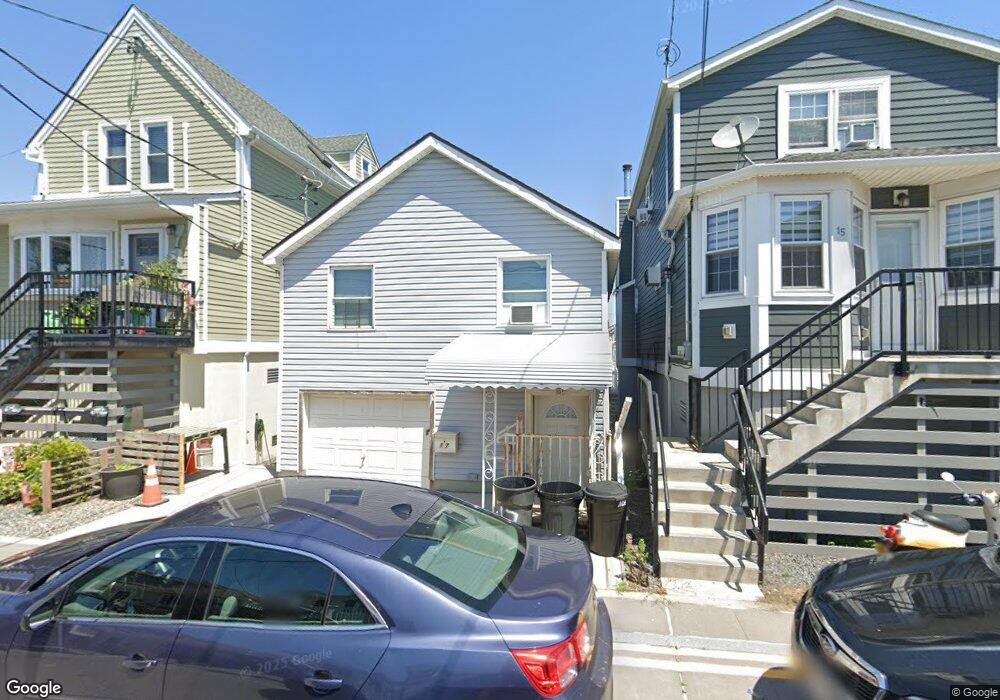
17 W 12th Rd Broad Channel, NY 11693
Broad Channel NeighborhoodEstimated Value: $545,000 - $637,000
2
Beds
2
Baths
1,488
Sq Ft
$401/Sq Ft
Est. Value
About This Home
This home is located at 17 W 12th Rd, Broad Channel, NY 11693 and is currently estimated at $597,420, approximately $401 per square foot. 17 W 12th Rd is a home located in Queens County with nearby schools including P.S. 47 - Chris Galas and St Rose of Lima Catholic Academy.
Ownership History
Date
Name
Owned For
Owner Type
Purchase Details
Closed on
Feb 23, 2007
Sold by
Benson Andrew S and Benson Pamela
Bought by
Deleon Aracelia
Current Estimated Value
Purchase Details
Closed on
Sep 26, 2005
Sold by
Benson Andrew S
Bought by
Benson Andrew S and Benson Pamela
Purchase Details
Closed on
Oct 2, 2003
Sold by
Beauchamp Richard F
Bought by
Benson Andrew S
Home Financials for this Owner
Home Financials are based on the most recent Mortgage that was taken out on this home.
Original Mortgage
$157,500
Interest Rate
6.01%
Mortgage Type
Purchase Money Mortgage
Purchase Details
Closed on
Aug 31, 2000
Sold by
Dicecco Michael J and Gersten Jack
Bought by
Beauchamp Richard F
Purchase Details
Closed on
Jun 17, 2000
Sold by
Dicecco Michael J and Gersten Jack
Bought by
Dicecco Michael J and Gersten Jack
Create a Home Valuation Report for This Property
The Home Valuation Report is an in-depth analysis detailing your home's value as well as a comparison with similar homes in the area
Home Values in the Area
Average Home Value in this Area
Purchase History
| Date | Buyer | Sale Price | Title Company |
|---|---|---|---|
| Deleon Aracelia | $265,000 | -- | |
| Deleon Aracelia | $265,000 | -- | |
| Benson Andrew S | -- | -- | |
| Benson Andrew S | -- | -- | |
| Benson Andrew S | $175,000 | -- | |
| Benson Andrew S | $175,000 | -- | |
| Beauchamp Richard F | $72,000 | -- | |
| Beauchamp Richard F | $72,000 | -- | |
| Dicecco Michael J | -- | -- | |
| Dicecco Michael J | -- | -- |
Source: Public Records
Mortgage History
| Date | Status | Borrower | Loan Amount |
|---|---|---|---|
| Previous Owner | Benson Andrew S | $157,500 | |
| Closed | Benson Andrew S | $0 |
Source: Public Records
Tax History Compared to Growth
Tax History
| Year | Tax Paid | Tax Assessment Tax Assessment Total Assessment is a certain percentage of the fair market value that is determined by local assessors to be the total taxable value of land and additions on the property. | Land | Improvement |
|---|---|---|---|---|
| 2025 | $2,851 | $14,970 | $3,534 | $11,436 |
| 2024 | $2,851 | $14,195 | $3,192 | $11,003 |
| 2023 | $2,802 | $13,799 | $3,443 | $10,356 |
| 2022 | $2,619 | $27,600 | $7,380 | $20,220 |
| 2021 | $2,625 | $26,280 | $7,380 | $18,900 |
| 2020 | $2,641 | $27,660 | $7,380 | $20,280 |
| 2019 | $2,475 | $26,880 | $7,380 | $19,500 |
| 2018 | $2,344 | $11,499 | $3,259 | $8,240 |
| 2017 | $2,228 | $10,932 | $3,567 | $7,365 |
| 2016 | $2,078 | $10,932 | $3,567 | $7,365 |
| 2015 | $1,244 | $10,396 | $4,025 | $6,371 |
| 2014 | $1,244 | $9,858 | $3,817 | $6,041 |
Source: Public Records
Map
Nearby Homes
- 27 W 11th Rd
- 33 W 11th Rd
- 35 W 11th Rd
- 22 W 10th Rd
- 20 W 10th Rd
- 33 W 12th Rd
- 1024 Cross Bay Blvd
- 803 Cross Bay Blvd
- 1317 Cross Bay Blvd
- 12 W 14th Rd
- 1234 Cross Bay Blvd
- 12-34 Cross Bay Blvd
- 12-38 Cross Bay Blvd
- 14-7 Cross Bay Blvd
- 120 E 8th Rd
- 815 Walton Rd
- 621 Cross Bay Blvd
- 118 E 6th Rd
- 21 W 18th Rd
- 20 W 18th Rd