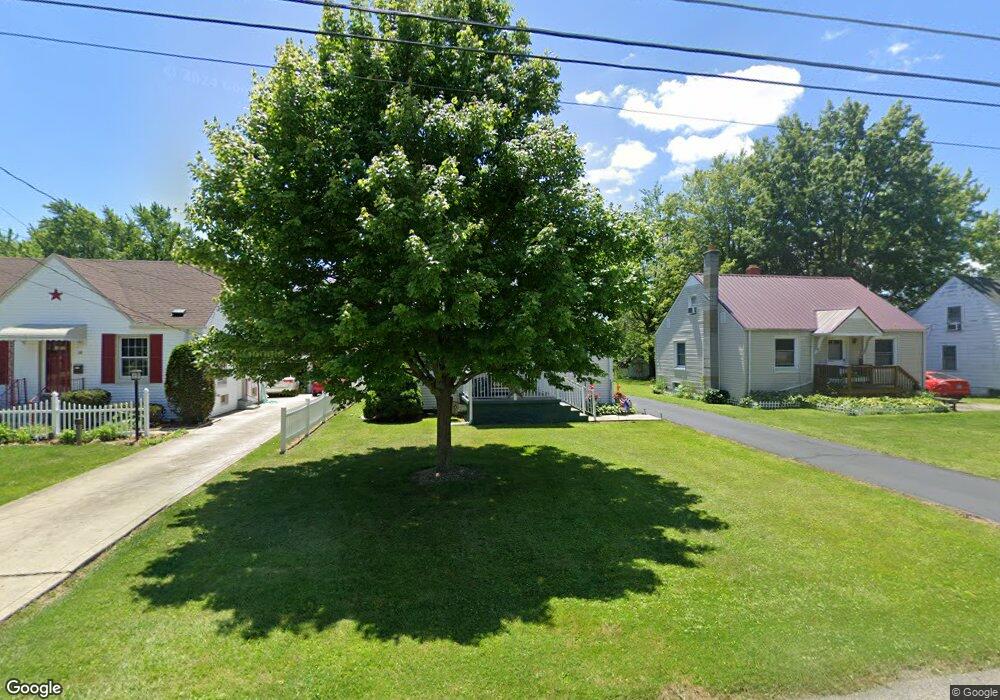
17 W End Blvd Shelby, OH 44875
Estimated Value: $137,250 - $165,000
2
Beds
1
Bath
1,092
Sq Ft
$137/Sq Ft
Est. Value
About This Home
This home is located at 17 W End Blvd, Shelby, OH 44875 and is currently estimated at $150,063, approximately $137 per square foot. 17 W End Blvd is a home located in Richland County with nearby schools including St. Mary's School.
Ownership History
Date
Name
Owned For
Owner Type
Purchase Details
Closed on
Mar 1, 2021
Sold by
Schaub James E and Schaub Patricia A
Bought by
Schaub James E
Current Estimated Value
Purchase Details
Closed on
Sep 14, 1998
Sold by
Fidler Jane D
Bought by
Schaub James E and Schaub Patricia A
Home Financials for this Owner
Home Financials are based on the most recent Mortgage that was taken out on this home.
Original Mortgage
$57,350
Interest Rate
7.06%
Mortgage Type
New Conventional
Purchase Details
Closed on
Aug 22, 1997
Sold by
Knight Blanche E
Bought by
Fidler Jane D
Create a Home Valuation Report for This Property
The Home Valuation Report is an in-depth analysis detailing your home's value as well as a comparison with similar homes in the area
Home Values in the Area
Average Home Value in this Area
Purchase History
| Date | Buyer | Sale Price | Title Company |
|---|---|---|---|
| Schaub James E | -- | None Available | |
| Schaub James E | $65,000 | -- | |
| Fidler Jane D | $29,000 | -- |
Source: Public Records
Mortgage History
| Date | Status | Borrower | Loan Amount |
|---|---|---|---|
| Closed | Schaub James E | $57,350 |
Source: Public Records
Tax History Compared to Growth
Tax History
| Year | Tax Paid | Tax Assessment Tax Assessment Total Assessment is a certain percentage of the fair market value that is determined by local assessors to be the total taxable value of land and additions on the property. | Land | Improvement |
|---|---|---|---|---|
| 2024 | $835 | $31,580 | $4,540 | $27,040 |
| 2023 | $835 | $31,580 | $4,540 | $27,040 |
| 2022 | $779 | $26,920 | $4,590 | $22,330 |
| 2021 | $780 | $26,920 | $4,590 | $22,330 |
| 2020 | $780 | $26,920 | $4,590 | $22,330 |
| 2019 | $679 | $23,250 | $3,890 | $19,360 |
| 2018 | $673 | $23,250 | $3,890 | $19,360 |
| 2017 | $666 | $23,250 | $3,890 | $19,360 |
| 2016 | $610 | $22,110 | $3,700 | $18,410 |
| 2015 | $607 | $22,110 | $3,700 | $18,410 |
| 2014 | $573 | $22,110 | $3,700 | $18,410 |
| 2012 | $573 | $22,100 | $3,890 | $18,210 |
Source: Public Records
Map
Nearby Homes