


Estimated payment $3,266/month
3
Beds
2
Baths
1,989
Sq Ft
$253
Price per Sq Ft
Highlights
- New Construction
- Loft
- Family Room
- Upper Merion Middle School Rated A
- Dining Room
About This Home
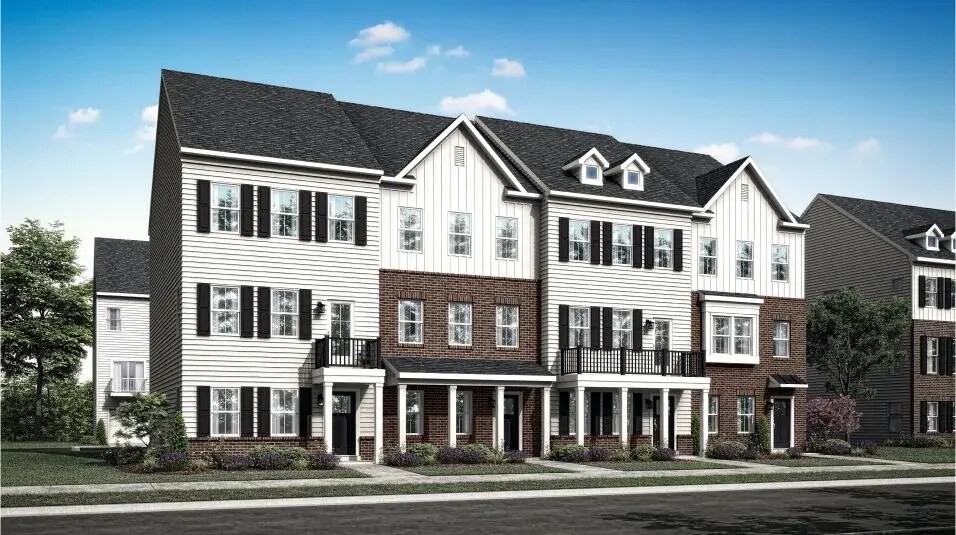
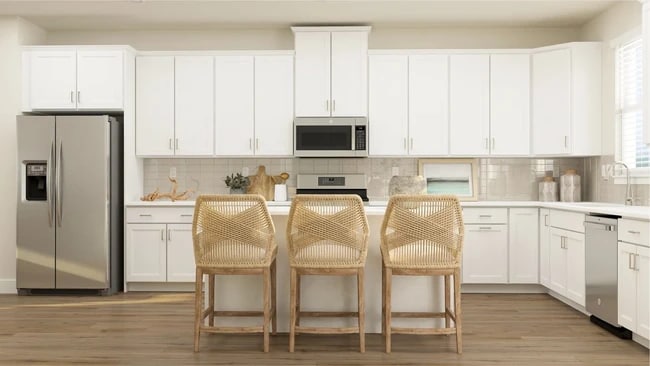
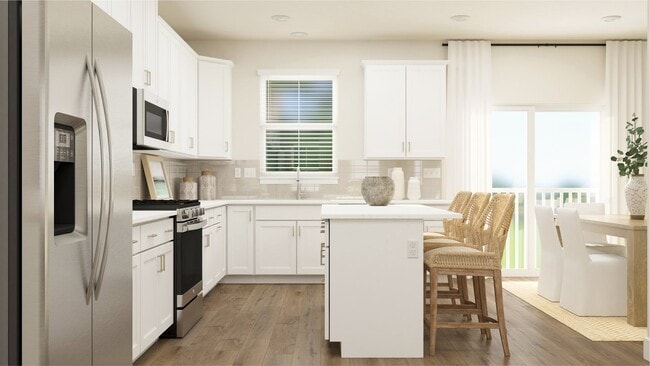
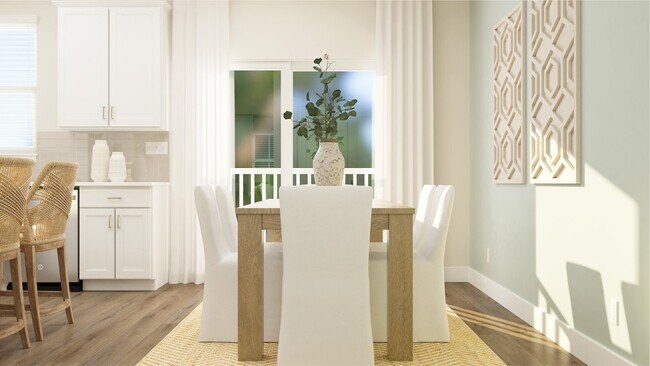
This popular Cambridge floor plan is under construction and ready for a October Move in! This home features 42 Soft close white cabinets, luxury vinyl flooring throughout the lower level Rec room and kitchen/ family room level. A spacious 10X17 composite deck off the kitchen is perfect for entertaining! On the 3rd floor you will find 3 bedrooms and laundry. All appliances are included with this home so just bring your suitcase and move right in! Call today to see this home and ask about our special financing options!
Townhouse Details
Home Type
- Townhome
HOA Fees
- $119 Monthly HOA Fees
Parking
- 2 Car Garage
Taxes
Home Design
- New Construction
Interior Spaces
- 3-Story Property
- Family Room
- Dining Room
- Loft
Bedrooms and Bathrooms
- 3 Bedrooms
- 2 Full Bathrooms
Map
Other Move In Ready Homes in River Pointe - Cambridge Townhomes
About the Builder
Since 1954, Lennar has built over one million new homes for families across America. They build in some of the nation’s most popular cities, and their communities cater to all lifestyles and family dynamics, whether you are a first-time or move-up buyer, multigenerational family, or Active Adult.
Nearby Homes
- River Pointe - Cambridge Townhomes
- 13 Ford St Unit A
- 13 Ford St Unit B
- 530 Grove St
- 201 8th St
- 205 8th St
- 448 E Airy St
- 438 E Airy St
- 324 E Moore St
- 355 E Moore St
- 301 E Marshall St
- 120 E Marshall St
- 534 Norris St
- 1225 Swede St
- 0 Astor St
- 107 Mahogany Ln
- Stonebrook at Upper Merion - Townes Collection
- 313 Aspen Way Unit HS 164- BRENTFORD
- 134 W Main St
- 1811 Arch St Unit 19W
Builder