17 Walcott St Oxford, MA 01540
Estimated Value: $368,000 - $413,737
3
Beds
1
Bath
1,384
Sq Ft
$286/Sq Ft
Est. Value
About This Home
This home is located at 17 Walcott St, Oxford, MA 01540 and is currently estimated at $396,184, approximately $286 per square foot. 17 Walcott St is a home located in Worcester County with nearby schools including Alfred M Chaffee, Oxford High School, and Clara Barton Elementary School.
Ownership History
Date
Name
Owned For
Owner Type
Purchase Details
Closed on
Nov 17, 2020
Sold by
Curran Richard D
Bought by
Benjamin Nicole M and Hartnett Daniel E
Current Estimated Value
Home Financials for this Owner
Home Financials are based on the most recent Mortgage that was taken out on this home.
Original Mortgage
$264,000
Interest Rate
2.6%
Mortgage Type
Purchase Money Mortgage
Create a Home Valuation Report for This Property
The Home Valuation Report is an in-depth analysis detailing your home's value as well as a comparison with similar homes in the area
Home Values in the Area
Average Home Value in this Area
Purchase History
| Date | Buyer | Sale Price | Title Company |
|---|---|---|---|
| Benjamin Nicole M | $330,000 | None Available |
Source: Public Records
Mortgage History
| Date | Status | Borrower | Loan Amount |
|---|---|---|---|
| Previous Owner | Benjamin Nicole M | $264,000 |
Source: Public Records
Tax History Compared to Growth
Tax History
| Year | Tax Paid | Tax Assessment Tax Assessment Total Assessment is a certain percentage of the fair market value that is determined by local assessors to be the total taxable value of land and additions on the property. | Land | Improvement |
|---|---|---|---|---|
| 2025 | $44 | $346,500 | $89,000 | $257,500 |
| 2024 | $4,213 | $312,500 | $82,600 | $229,900 |
| 2023 | $4,205 | $308,300 | $73,700 | $234,600 |
| 2022 | $3,642 | $225,400 | $65,200 | $160,200 |
| 2021 | $3,404 | $205,900 | $62,000 | $143,900 |
| 2020 | $3,152 | $189,200 | $62,000 | $127,200 |
| 2019 | $3,344 | $163,700 | $61,900 | $101,800 |
| 2018 | $2,827 | $163,700 | $61,900 | $101,800 |
| 2017 | $2,839 | $168,500 | $61,900 | $106,600 |
| 2016 | $2,853 | $168,500 | $61,900 | $106,600 |
| 2015 | $2,661 | $168,500 | $61,900 | $106,600 |
| 2014 | $2,622 | $174,800 | $61,900 | $112,900 |
Source: Public Records
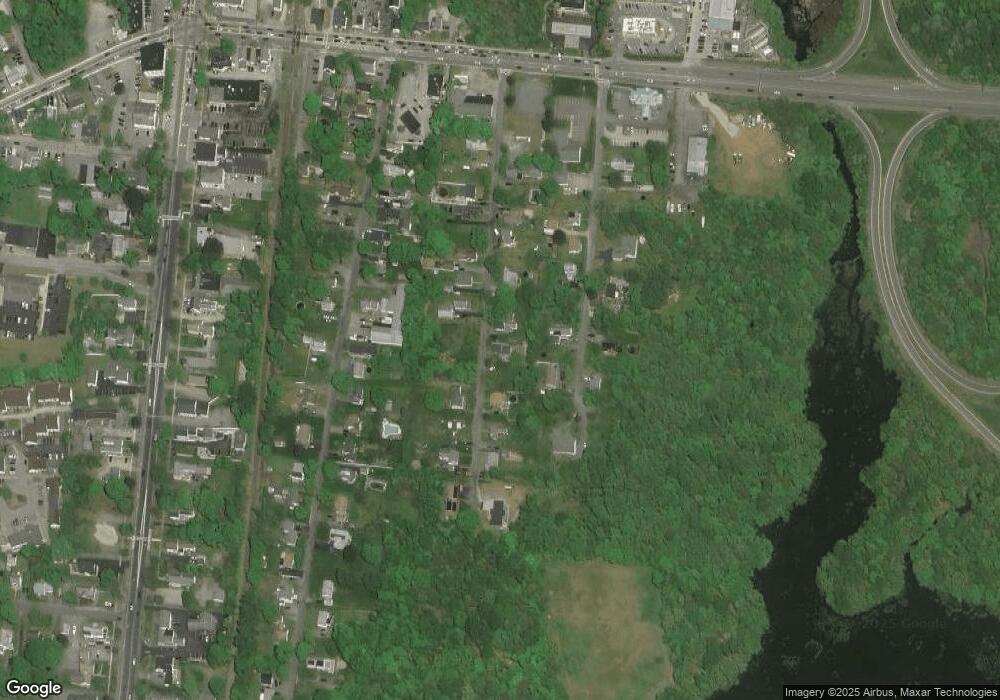
Map
Nearby Homes