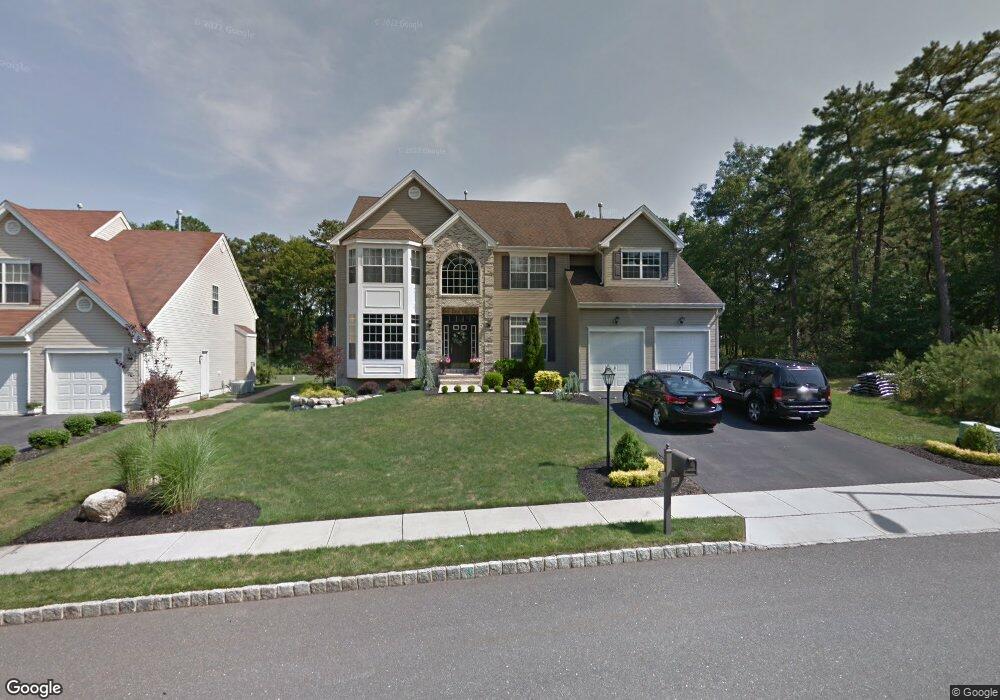
17 Watts Ave Barnegat, NJ 08005
Barnegat Township NeighborhoodEstimated Value: $674,704 - $749,000
4
Beds
3
Baths
2,886
Sq Ft
$241/Sq Ft
Est. Value
About This Home
This home is located at 17 Watts Ave, Barnegat, NJ 08005 and is currently estimated at $694,676, approximately $240 per square foot. 17 Watts Ave is a home located in Ocean County with nearby schools including Barnegat High School and St. Mary Academy.
Ownership History
Date
Name
Owned For
Owner Type
Purchase Details
Closed on
Nov 30, 2005
Current Estimated Value
Home Financials for this Owner
Home Financials are based on the most recent Mortgage that was taken out on this home.
Original Mortgage
$360,272
Outstanding Balance
$199,774
Interest Rate
6.14%
Mortgage Type
Fannie Mae Freddie Mac
Estimated Equity
$494,902
Purchase Details
Closed on
Aug 12, 2004
Sold by
Mormelo Walter and Mormelo Marie
Bought by
Walters Development Co Llc
Create a Home Valuation Report for This Property
The Home Valuation Report is an in-depth analysis detailing your home's value as well as a comparison with similar homes in the area
Home Values in the Area
Average Home Value in this Area
Purchase History
| Date | Buyer | Sale Price | Title Company |
|---|---|---|---|
| -- | $400,300 | -- | |
| Kononowitz Keith M | $400,303 | -- | |
| Walters Development Co Llc | $50,000 | Fidelity National Title Insu |
Source: Public Records
Mortgage History
| Date | Status | Borrower | Loan Amount |
|---|---|---|---|
| Open | Kononowitz Keith M | $360,272 | |
| Closed | -- | $360,272 |
Source: Public Records
Tax History Compared to Growth
Tax History
| Year | Tax Paid | Tax Assessment Tax Assessment Total Assessment is a certain percentage of the fair market value that is determined by local assessors to be the total taxable value of land and additions on the property. | Land | Improvement |
|---|---|---|---|---|
| 2025 | $10,601 | $356,100 | $85,500 | $270,600 |
| 2024 | $10,366 | $356,100 | $85,500 | $270,600 |
| 2023 | $10,031 | $356,100 | $85,500 | $270,600 |
| 2022 | $10,031 | $356,100 | $85,500 | $270,600 |
| 2021 | $9,650 | $338,200 | $85,500 | $252,700 |
| 2020 | $9,439 | $338,200 | $85,500 | $252,700 |
| 2019 | $9,301 | $338,200 | $85,500 | $252,700 |
| 2018 | $9,229 | $338,200 | $85,500 | $252,700 |
| 2017 | $9,077 | $338,200 | $85,500 | $252,700 |
| 2016 | $8,891 | $338,200 | $85,500 | $252,700 |
| 2015 | $8,611 | $338,200 | $85,500 | $252,700 |
| 2014 | $8,391 | $338,200 | $85,500 | $252,700 |
Source: Public Records
Map
Nearby Homes