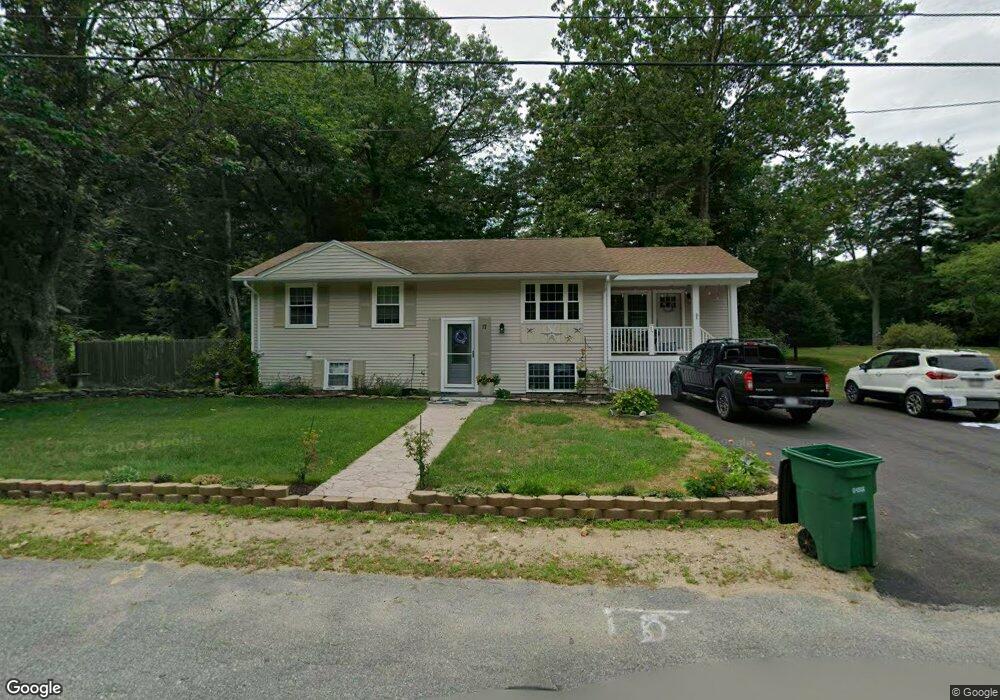
17 Yale Rd Pembroke, MA 02359
Estimated Value: $601,000 - $605,285
3
Beds
1
Bath
1,425
Sq Ft
$423/Sq Ft
Est. Value
About This Home
This home is located at 17 Yale Rd, Pembroke, MA 02359 and is currently estimated at $603,071, approximately $423 per square foot. 17 Yale Rd is a home located in Plymouth County with nearby schools including Pembroke High School.
Ownership History
Date
Name
Owned For
Owner Type
Purchase Details
Closed on
Jan 8, 2009
Sold by
Piccuito Kurt
Bought by
Piccuito Kurt and Nogueira Jillian
Current Estimated Value
Purchase Details
Closed on
Apr 30, 2007
Sold by
Countrywide Home Loan and Hsbc Bank Usa
Bought by
Piccuito Kurt
Home Financials for this Owner
Home Financials are based on the most recent Mortgage that was taken out on this home.
Original Mortgage
$268,000
Interest Rate
6.18%
Mortgage Type
Purchase Money Mortgage
Purchase Details
Closed on
Apr 24, 2007
Sold by
Ford Amy
Bought by
Hsbc Bank Usa
Home Financials for this Owner
Home Financials are based on the most recent Mortgage that was taken out on this home.
Original Mortgage
$268,000
Interest Rate
6.18%
Mortgage Type
Purchase Money Mortgage
Purchase Details
Closed on
May 3, 2005
Sold by
Barnes Charles E
Bought by
Ford Amy
Purchase Details
Closed on
Dec 1, 1989
Sold by
Barnes Doretha
Bought by
Barnes Charles E
Create a Home Valuation Report for This Property
The Home Valuation Report is an in-depth analysis detailing your home's value as well as a comparison with similar homes in the area
Home Values in the Area
Average Home Value in this Area
Purchase History
| Date | Buyer | Sale Price | Title Company |
|---|---|---|---|
| Piccuito Kurt | -- | -- | |
| Piccuito Kurt | $268,000 | -- | |
| Hsbc Bank Usa | $275,258 | -- | |
| Ford Amy | $325,000 | -- | |
| Barnes Charles E | $130,000 | -- |
Source: Public Records
Mortgage History
| Date | Status | Borrower | Loan Amount |
|---|---|---|---|
| Open | Barnes Charles E | $254,195 | |
| Previous Owner | Barnes Charles E | $268,000 |
Source: Public Records
Tax History Compared to Growth
Tax History
| Year | Tax Paid | Tax Assessment Tax Assessment Total Assessment is a certain percentage of the fair market value that is determined by local assessors to be the total taxable value of land and additions on the property. | Land | Improvement |
|---|---|---|---|---|
| 2025 | $5,988 | $498,200 | $259,500 | $238,700 |
| 2024 | $5,760 | $478,800 | $241,600 | $237,200 |
| 2023 | $5,901 | $463,900 | $241,600 | $222,300 |
| 2022 | $5,376 | $379,900 | $197,700 | $182,200 |
| 2021 | $4,868 | $333,900 | $188,600 | $145,300 |
| 2020 | $4,453 | $307,300 | $180,200 | $127,100 |
| 2019 | $4,370 | $299,300 | $175,600 | $123,700 |
| 2018 | $3,968 | $266,500 | $158,100 | $108,400 |
| 2017 | $3,896 | $258,000 | $149,600 | $108,400 |
| 2016 | $3,806 | $249,400 | $141,000 | $108,400 |
| 2015 | $3,412 | $231,500 | $128,100 | $103,400 |
Source: Public Records
Map
Nearby Homes