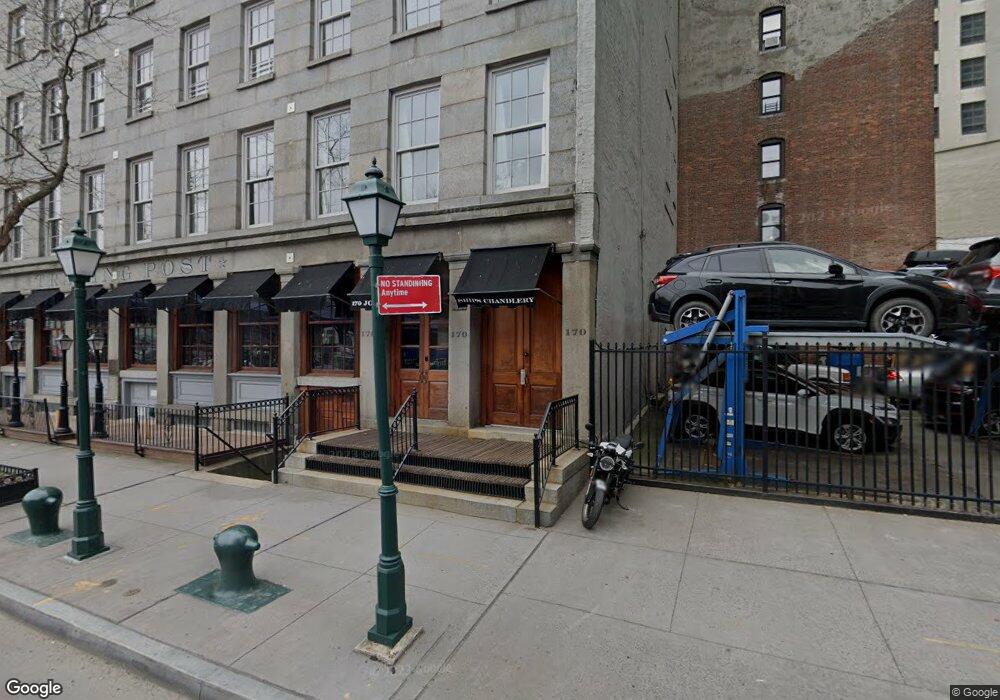
170-176 John St Unit 3/4D New York, NY 10038
Financial District NeighborhoodEstimated Value: $1,507,000 - $1,620,000
--
Bed
--
Bath
1,240
Sq Ft
$1,269/Sq Ft
Est. Value
About This Home
This home is located at 170-176 John St Unit 3/4D, New York, NY 10038 and is currently estimated at $1,573,426, approximately $1,268 per square foot. 170-176 John St Unit 3/4D is a home located in New York County with nearby schools including P.S. 343 The Peck Slip School, Lower Manhattan Community Middle School, and Clinton School.
Ownership History
Date
Name
Owned For
Owner Type
Purchase Details
Closed on
Sep 24, 2024
Sold by
Oh Eugene and Oh Moon Ja
Bought by
Oh Eugene
Current Estimated Value
Purchase Details
Closed on
Nov 1, 2020
Sold by
Oh Deceased Sung and Oh Oh
Bought by
Oh Eugene and Oh Moon Ja
Purchase Details
Closed on
Sep 1, 2017
Sold by
Schmatz Eva
Bought by
Oh Eugene and Oh Moon Ja
Purchase Details
Closed on
Nov 30, 2006
Sold by
Romeo Andrew F
Bought by
Schmatz Eva
Home Financials for this Owner
Home Financials are based on the most recent Mortgage that was taken out on this home.
Original Mortgage
$700,000
Interest Rate
6.31%
Mortgage Type
Purchase Money Mortgage
Purchase Details
Closed on
May 29, 1997
Sold by
Cooney Patrick J
Bought by
Romeo Andrew F
Home Financials for this Owner
Home Financials are based on the most recent Mortgage that was taken out on this home.
Original Mortgage
$243,000
Interest Rate
7.55%
Mortgage Type
Purchase Money Mortgage
Create a Home Valuation Report for This Property
The Home Valuation Report is an in-depth analysis detailing your home's value as well as a comparison with similar homes in the area
Home Values in the Area
Average Home Value in this Area
Purchase History
| Date | Buyer | Sale Price | Title Company |
|---|---|---|---|
| Oh Eugene | -- | -- | |
| Oh Eugene | -- | -- | |
| Oh Eugene | -- | -- | |
| Oh Eugene | $1,576,000 | -- | |
| Oh Eugene | $1,576,000 | -- | |
| Schmatz Eva | $1,200,000 | -- | |
| Schmatz Eva | $1,200,000 | -- | |
| Romeo Andrew F | $270,000 | Commonwealth Land Title Ins | |
| Romeo Andrew F | $270,000 | Commonwealth Land Title Ins |
Source: Public Records
Mortgage History
| Date | Status | Borrower | Loan Amount |
|---|---|---|---|
| Previous Owner | Schmatz Eva | $700,000 | |
| Previous Owner | Romeo Andrew F | $243,000 |
Source: Public Records
Tax History Compared to Growth
Tax History
| Year | Tax Paid | Tax Assessment Tax Assessment Total Assessment is a certain percentage of the fair market value that is determined by local assessors to be the total taxable value of land and additions on the property. | Land | Improvement |
|---|---|---|---|---|
| 2025 | $25,537 | $201,532 | $23,124 | $178,408 |
| 2024 | $25,537 | $204,261 | $23,124 | $181,137 |
| 2023 | $20,059 | $198,206 | $23,124 | $175,082 |
| 2022 | $18,983 | $188,065 | $23,124 | $164,941 |
| 2021 | $23,070 | $188,065 | $23,124 | $164,941 |
| 2020 | $19,085 | $208,286 | $23,124 | $185,162 |
| 2019 | $18,713 | $203,606 | $23,124 | $180,482 |
| 2018 | $22,885 | $196,488 | $23,125 | $173,363 |
| 2017 | $22,210 | $191,608 | $23,124 | $168,484 |
| 2016 | $21,835 | $171,621 | $23,124 | $148,497 |
| 2015 | $11,160 | $153,439 | $23,124 | $130,315 |
| 2014 | $11,160 | $118,091 | $23,124 | $94,967 |
Source: Public Records
Map
Nearby Homes
- 130 Water St Unit 3C
- 115 South St
- 101 Wall St Unit 4B
- 101 Wall St Unit 11C
- 101 Wall St Unit 17A
- 101 Wall St Unit PH-A
- 99 John St Unit 2006
- 99 John St Unit 612
- 99 John St Unit 920
- 99 John St Unit 2210
- 99 John St Unit 417
- 99 John St Unit 2201
- 99 John St Unit 1112
- 99 John St Unit 1102
- 99 John St Unit 1405
- 99 John St Unit 425
- 99 John St Unit 524
- 99 John St Unit 205
- 99 John St Unit 2109
- 99 John St Unit 1501
- 170 John St Unit 176
- 170 John St Unit 176
- 170 John St Unit 176
- 170 John St Unit 176
- 170 John St Unit 176
- 170 John St Unit 2D176
- 170 John St Unit 2C176
- 170 John St Unit 2B176
- 170 John St Unit 2A176
- 170 John St Unit 3-A
- 170 John St Unit 3A/4A
- 170 John St Unit 2D
- 170-176 John St Unit D
- 170-176 John St Unit 3/4A
- 170-176 John St Unit 3/4E
- 170-176 John St Unit E
- 170-176 John St Unit 3/4B
- 170-176 John St Unit 2D
- 170-176 John St Unit 2B
- 170-176 John St Unit B