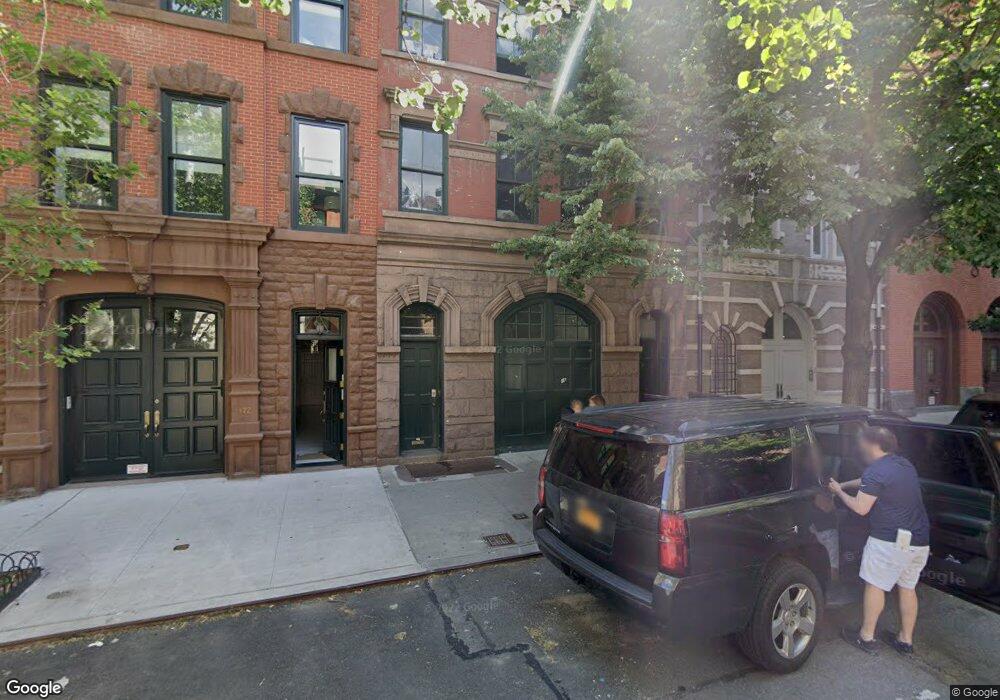
170 E 73rd St New York, NY 10021
Hillcrest NeighborhoodEstimated Value: $13,707,260
--
Bed
--
Bath
5,800
Sq Ft
$2,363/Sq Ft
Est. Value
About This Home
This home is located at 170 E 73rd St, New York, NY 10021 and is currently estimated at $13,707,260, approximately $2,363 per square foot. 170 E 73rd St is a home located in New York County with nearby schools including P.S. 173 - Fresh Meadow and George J. Ryan Middle School 216.
Ownership History
Date
Name
Owned For
Owner Type
Purchase Details
Closed on
Oct 9, 2012
Sold by
Pitman Gerald H M D
Bought by
170 East 73Rd Street Llc
Current Estimated Value
Purchase Details
Closed on
Mar 15, 2000
Sold by
Wynn Rita and Wynn Seymour
Bought by
Pitman Gerald H
Home Financials for this Owner
Home Financials are based on the most recent Mortgage that was taken out on this home.
Original Mortgage
$2,820,000
Interest Rate
7.87%
Mortgage Type
Commercial
Purchase Details
Closed on
Feb 10, 1995
Sold by
Wynn Dan and Wynn Rita
Bought by
Wynn Dan and Wynn Rita
Create a Home Valuation Report for This Property
The Home Valuation Report is an in-depth analysis detailing your home's value as well as a comparison with similar homes in the area
Home Values in the Area
Average Home Value in this Area
Purchase History
| Date | Buyer | Sale Price | Title Company |
|---|---|---|---|
| 170 East 73Rd Street Llc | $10,250,000 | -- | |
| 170 East 73Rd Street Llc | $10,250,000 | -- | |
| Pitman Gerald H | $2,820,000 | Titleserv | |
| Pitman Gerald H | $2,820,000 | Titleserv | |
| Wynn Dan | -- | -- | |
| Wynn Dan | -- | -- |
Source: Public Records
Mortgage History
| Date | Status | Borrower | Loan Amount |
|---|---|---|---|
| Previous Owner | Pitman Gerald H | $2,820,000 |
Source: Public Records
Tax History Compared to Growth
Tax History
| Year | Tax Paid | Tax Assessment Tax Assessment Total Assessment is a certain percentage of the fair market value that is determined by local assessors to be the total taxable value of land and additions on the property. | Land | Improvement |
|---|---|---|---|---|
| 2025 | $103,325 | $545,304 | $251,393 | $293,911 |
| 2024 | $103,325 | $514,438 | $283,800 | $289,737 |
| 2023 | $98,564 | $485,320 | $180,228 | $305,092 |
| 2022 | $91,401 | $646,980 | $283,800 | $363,180 |
| 2021 | $96,355 | $626,820 | $283,800 | $343,020 |
| 2020 | $96,187 | $746,580 | $283,800 | $462,780 |
| 2019 | $89,679 | $785,880 | $283,800 | $502,080 |
| 2018 | $82,444 | $404,433 | $172,728 | $231,705 |
| 2017 | $77,777 | $381,542 | $171,353 | $210,189 |
| 2016 | $76,274 | $381,542 | $183,516 | $198,026 |
| 2015 | $28,942 | $378,683 | $154,825 | $223,858 |
| 2014 | $28,942 | $357,249 | $175,271 | $181,978 |
Source: Public Records
Map
Nearby Homes