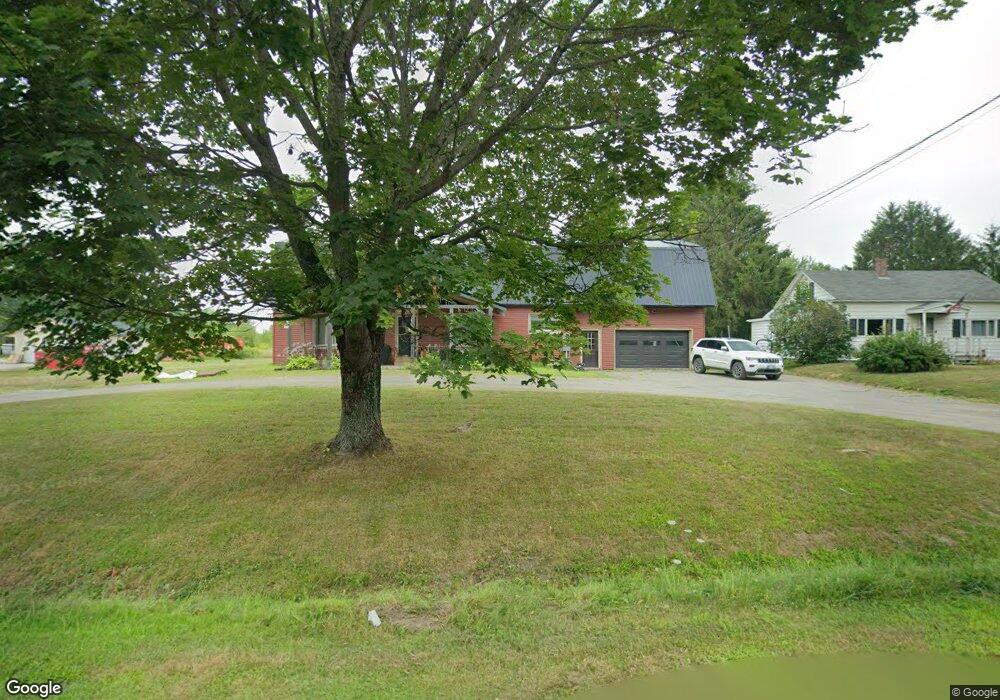
170 Elm St Newport, ME 04953
Estimated Value: $238,905 - $309,000
3
Beds
2
Baths
1,500
Sq Ft
$176/Sq Ft
Est. Value
About This Home
This home is located at 170 Elm St, Newport, ME 04953 and is currently estimated at $264,226, approximately $176 per square foot. 170 Elm St is a home located in Penobscot County with nearby schools including Sebasticook Valley Elementary School and Nokomis Regional Middle School/High School.
Ownership History
Date
Name
Owned For
Owner Type
Purchase Details
Closed on
Aug 25, 2020
Sold by
Russell Kyle and Russell Roxanne
Bought by
Labonte Jason T and Labonte Staci B
Current Estimated Value
Home Financials for this Owner
Home Financials are based on the most recent Mortgage that was taken out on this home.
Original Mortgage
$115,000
Outstanding Balance
$102,242
Interest Rate
3%
Mortgage Type
New Conventional
Estimated Equity
$161,984
Create a Home Valuation Report for This Property
The Home Valuation Report is an in-depth analysis detailing your home's value as well as a comparison with similar homes in the area
Home Values in the Area
Average Home Value in this Area
Purchase History
| Date | Buyer | Sale Price | Title Company |
|---|---|---|---|
| Labonte Jason T | -- | None Available |
Source: Public Records
Mortgage History
| Date | Status | Borrower | Loan Amount |
|---|---|---|---|
| Open | Labonte Jason T | $115,000 |
Source: Public Records
Tax History Compared to Growth
Tax History
| Year | Tax Paid | Tax Assessment Tax Assessment Total Assessment is a certain percentage of the fair market value that is determined by local assessors to be the total taxable value of land and additions on the property. | Land | Improvement |
|---|---|---|---|---|
| 2024 | $3,059 | $174,800 | $22,600 | $152,200 |
| 2023 | $2,077 | $127,400 | $21,100 | $106,300 |
| 2022 | $1,974 | $100,700 | $16,700 | $84,000 |
| 2021 | $1,982 | $96,200 | $15,900 | $80,300 |
| 2020 | $1,906 | $92,500 | $15,600 | $76,900 |
| 2019 | $1,862 | $87,400 | $14,800 | $72,600 |
| 2018 | $1,885 | $88,500 | $14,800 | $73,700 |
| 2017 | $1,770 | $88,500 | $14,800 | $73,700 |
| 2016 | $1,717 | $88,500 | $14,800 | $73,700 |
| 2015 | $1,584 | $88,500 | $14,800 | $73,700 |
| 2014 | $1,522 | $88,500 | $14,800 | $73,700 |
Source: Public Records
Map
Nearby Homes