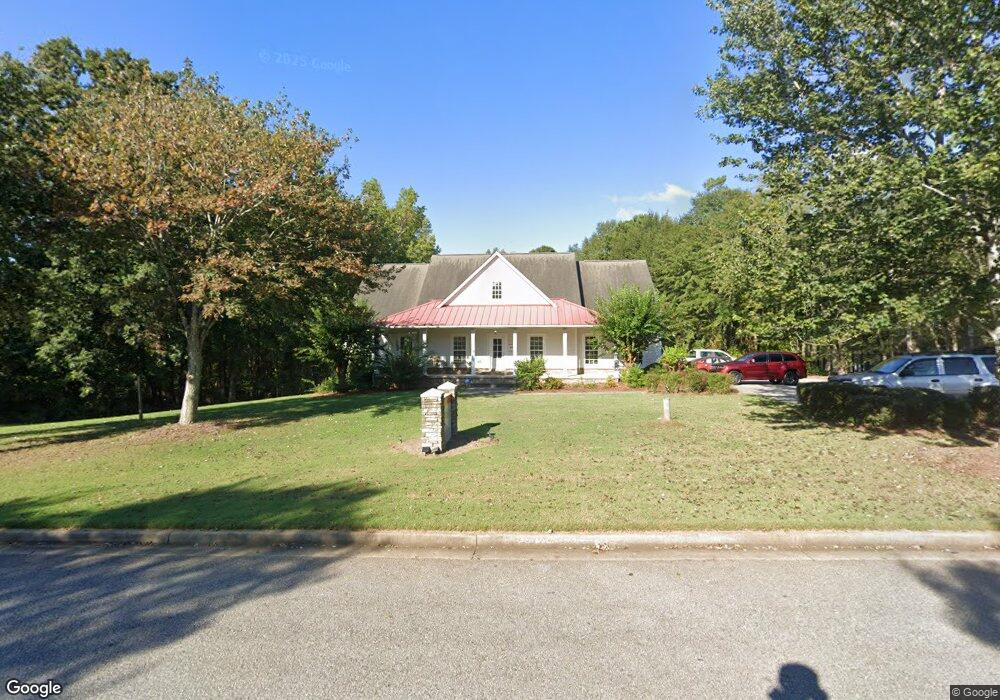
170 Greencastle Rd Tyrone, GA 30290
Estimated Value: $796,104
Studio
--
Bath
5,006
Sq Ft
$159/Sq Ft
Est. Value
About This Home
This home is located at 170 Greencastle Rd, Tyrone, GA 30290 and is currently estimated at $796,104, approximately $159 per square foot. 170 Greencastle Rd is a home located in Fayette County with nearby schools including Crabapple Lane Elementary School, Flat Rock Middle School, and Sandy Creek High School.
Ownership History
Date
Name
Owned For
Owner Type
Purchase Details
Closed on
Mar 24, 2020
Sold by
Assoc Of State & Provincial Psychology B
Bought by
Gymaf Llc
Current Estimated Value
Home Financials for this Owner
Home Financials are based on the most recent Mortgage that was taken out on this home.
Original Mortgage
$420,750
Interest Rate
3.4%
Mortgage Type
Commercial
Purchase Details
Closed on
Nov 19, 2009
Sold by
Regions Bk
Bought by
Association Of St & Provincial
Purchase Details
Closed on
Mar 13, 2008
Sold by
Mangum Robert A
Bought by
Beta Construction Inc
Purchase Details
Closed on
Apr 19, 2003
Sold by
Csn Properties Llc
Bought by
Countryplace Homes Inc
Create a Home Valuation Report for This Property
The Home Valuation Report is an in-depth analysis detailing your home's value as well as a comparison with similar homes in the area
Home Values in the Area
Average Home Value in this Area
Purchase History
| Date | Buyer | Sale Price | Title Company |
|---|---|---|---|
| Gymaf Llc | $495,000 | -- | |
| Association Of St & Provincial | $399,000 | -- | |
| Beta Construction Inc | $323,500 | -- | |
| Countryplace Homes Inc | $80,000 | -- | |
| Csn Properties Inc | -- | -- |
Source: Public Records
Mortgage History
| Date | Status | Borrower | Loan Amount |
|---|---|---|---|
| Closed | Gymaf Llc | $420,750 |
Source: Public Records
Tax History
| Year | Tax Paid | Tax Assessment Tax Assessment Total Assessment is a certain percentage of the fair market value that is determined by local assessors to be the total taxable value of land and additions on the property. | Land | Improvement |
|---|---|---|---|---|
| 2024 | $8,105 | $269,876 | $40,000 | $229,876 |
| 2023 | $8,926 | $290,240 | $40,000 | $250,240 |
Source: Public Records
Map
Nearby Homes
- 108 Tullamore Trail
- 113 Creggan Hill Ct
- 100 Leisure Trail
- 178 Crabapple Ln
- 140 Devonshire Place
- 206 Las Brasis Ct
- 160 Wickham Dr
- 404 Las Brasis Ct
- 110 Sutton Ct
- 377 Dogwood Trail
- 320 Dalston Way
- 308 Dalston Way
- 152 Ardenlee Dr
- 301 Abercorn Square
- 230 Smokerise Trace
- 231 Clifton Ln
- 100 Smokerise Trace
- 2230 Castle Lake Dr
- 2185 Castle Lake Dr
- 250 Chimney Springs
- 180 Greencastle Rd Unit WILIAMSBURG
- 160 Greencastle Rd Unit SUITE D
- 160 Greencastle Rd Unit SUITE E
- 160 Greencastle Rd Unit SUITE A
- 190 Greencastle Rd Unit Upstairs
- 145 Greencastle Rd
- 225 Meadowood Ln
- 215 Meadowood Ln
- 140 Greencastle Rd
- 140 Greencastle Rd Unit Lot 4
- 175 Greencastle Rd
- 210 Market Rd
- 215 Market Rd
- 205 Meadowood Ln
- 155 Cicely Way
- 110 Cicely Way
- 115 Cicely Way
- 195 Cicely Way
- 130 Cicely Way
- 185 Cicely Way