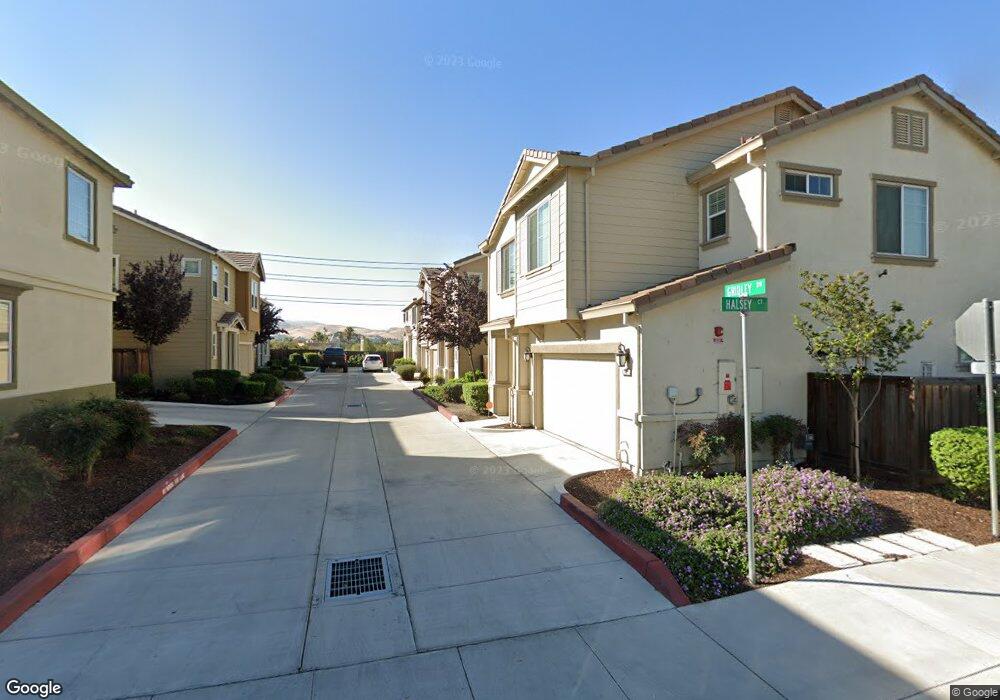
170 Halsey Way Pittsburg, CA 94565
Downtown Pittsburg NeighborhoodEstimated Value: $524,000 - $697,000
4
Beds
3
Baths
1,829
Sq Ft
$335/Sq Ft
Est. Value
About This Home
This home is located at 170 Halsey Way, Pittsburg, CA 94565 and is currently estimated at $612,548, approximately $334 per square foot. 170 Halsey Way is a home located in Contra Costa County with nearby schools including Marina Vista Elementary School, Martin Luther King Jr. Junior High School, and Pittsburg Senior High School.
Ownership History
Date
Name
Owned For
Owner Type
Purchase Details
Closed on
Apr 24, 2018
Sold by
Schramm Lauren
Bought by
Lee Kam H and Chu Mel Yee C
Current Estimated Value
Home Financials for this Owner
Home Financials are based on the most recent Mortgage that was taken out on this home.
Original Mortgage
$454,122
Outstanding Balance
$390,628
Interest Rate
4.45%
Mortgage Type
FHA
Estimated Equity
$221,920
Purchase Details
Closed on
Apr 26, 2016
Sold by
Schramm Joshua A
Bought by
Schramm Lauren
Home Financials for this Owner
Home Financials are based on the most recent Mortgage that was taken out on this home.
Original Mortgage
$338,400
Interest Rate
3.73%
Mortgage Type
New Conventional
Create a Home Valuation Report for This Property
The Home Valuation Report is an in-depth analysis detailing your home's value as well as a comparison with similar homes in the area
Home Values in the Area
Average Home Value in this Area
Purchase History
| Date | Buyer | Sale Price | Title Company |
|---|---|---|---|
| Lee Kam H | $462,500 | Fidelity National Title Comp | |
| Schramm Lauren | -- | Old Republic Title Company | |
| Schramm Lauren | $423,000 | Old Republic Title Company |
Source: Public Records
Mortgage History
| Date | Status | Borrower | Loan Amount |
|---|---|---|---|
| Open | Lee Kam H | $454,122 | |
| Previous Owner | Schramm Lauren | $338,400 |
Source: Public Records
Tax History Compared to Growth
Tax History
| Year | Tax Paid | Tax Assessment Tax Assessment Total Assessment is a certain percentage of the fair market value that is determined by local assessors to be the total taxable value of land and additions on the property. | Land | Improvement |
|---|---|---|---|---|
| 2025 | $7,162 | $526,241 | $193,429 | $332,812 |
| 2024 | $7,127 | $515,924 | $189,637 | $326,287 |
| 2023 | $7,127 | $505,809 | $185,919 | $319,890 |
| 2022 | $7,185 | $495,892 | $182,274 | $313,618 |
| 2021 | $7,161 | $486,169 | $178,700 | $307,469 |
| 2019 | $6,799 | $471,750 | $173,400 | $298,350 |
| 2018 | $6,357 | $440,089 | $176,868 | $263,221 |
| 2017 | $6,302 | $431,460 | $173,400 | $258,060 |
| 2016 | $2,166 | $95,302 | $50,902 | $44,400 |
| 2015 | $710 | $50,138 | $50,138 | $0 |
| 2014 | $145 | $3,415 | $3,415 | $0 |
Source: Public Records
Map
Nearby Homes
- 1037 Gridley Dr
- 401 W 9th St
- 118 Pelican Loop
- 115 Pelican Loop
- 340 Cumberland St
- 65 Locust Dr
- 76 Cornwall St
- 301 Central Ave
- 161 Edgewater Place
- 310 Central Ave
- 65 Edgewater Place
- 181 Maidenhair St
- 221 Bruno Ave
- 449-451 E 9th St
- Daphne Plan at Liberty II
- Charlotte Plan at Liberty II
- Aubrey Plan at Liberty II
- Baxter Plan at Liberty II
- 286 Mindy Way
- 278 Mindy Way