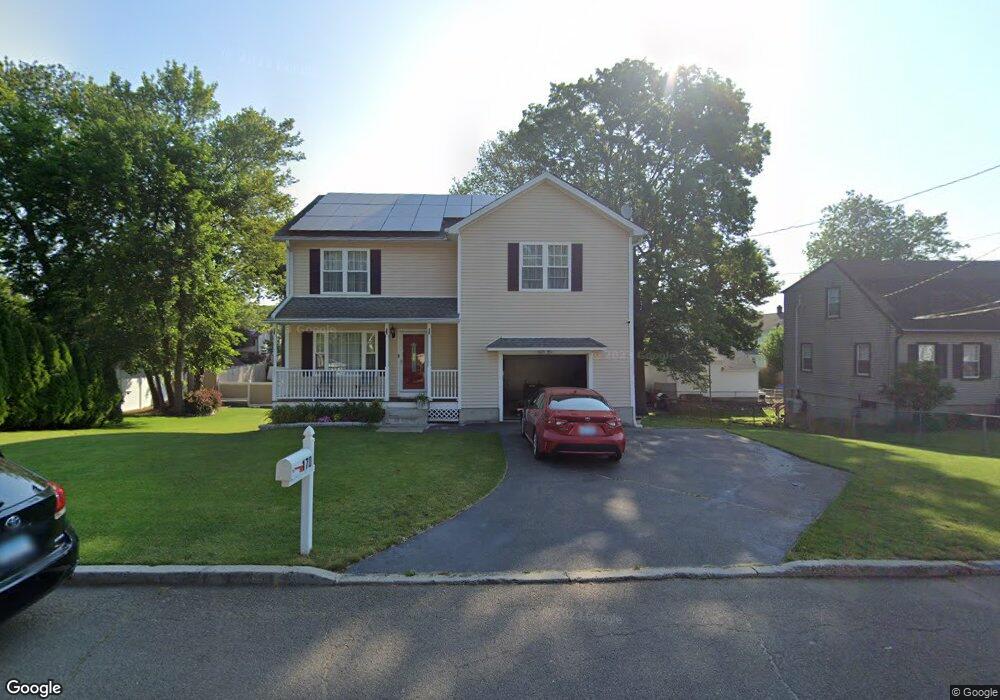
170 Infield St Bridgeport, CT 06606
North End NeighborhoodEstimated Value: $457,000 - $502,000
3
Beds
2
Baths
1,856
Sq Ft
$261/Sq Ft
Est. Value
About This Home
This home is located at 170 Infield St, Bridgeport, CT 06606 and is currently estimated at $484,694, approximately $261 per square foot. 170 Infield St is a home located in Fairfield County with nearby schools including Blackham School, Central High School, and Northeastern Adventist Academy - Fairfield County.
Ownership History
Date
Name
Owned For
Owner Type
Purchase Details
Closed on
Apr 7, 2004
Sold by
Caravan Developers Llc
Bought by
Dixon Neville
Current Estimated Value
Home Financials for this Owner
Home Financials are based on the most recent Mortgage that was taken out on this home.
Original Mortgage
$276,900
Outstanding Balance
$129,760
Interest Rate
5.6%
Estimated Equity
$354,934
Purchase Details
Closed on
Jun 30, 2003
Sold by
Berezq Paul
Bought by
Caravan Dev Llc
Home Financials for this Owner
Home Financials are based on the most recent Mortgage that was taken out on this home.
Original Mortgage
$144,000
Interest Rate
5.53%
Create a Home Valuation Report for This Property
The Home Valuation Report is an in-depth analysis detailing your home's value as well as a comparison with similar homes in the area
Home Values in the Area
Average Home Value in this Area
Purchase History
| Date | Buyer | Sale Price | Title Company |
|---|---|---|---|
| Dixon Neville | $296,900 | -- | |
| Dixon Neville | $296,900 | -- | |
| Caravan Dev Llc | $60,000 | -- | |
| Caravan Dev Llc | $60,000 | -- |
Source: Public Records
Mortgage History
| Date | Status | Borrower | Loan Amount |
|---|---|---|---|
| Open | Caravan Dev Llc | $276,900 | |
| Closed | Caravan Dev Llc | $276,900 | |
| Previous Owner | Caravan Dev Llc | $144,000 |
Source: Public Records
Tax History Compared to Growth
Tax History
| Year | Tax Paid | Tax Assessment Tax Assessment Total Assessment is a certain percentage of the fair market value that is determined by local assessors to be the total taxable value of land and additions on the property. | Land | Improvement |
|---|---|---|---|---|
| 2025 | $8,757 | $201,540 | $74,660 | $126,880 |
| 2024 | $8,757 | $201,540 | $74,660 | $126,880 |
| 2023 | $8,757 | $201,540 | $74,660 | $126,880 |
| 2022 | $8,757 | $201,540 | $74,660 | $126,880 |
| 2021 | $8,757 | $201,540 | $74,660 | $126,880 |
| 2020 | $9,000 | $166,690 | $45,230 | $121,460 |
| 2019 | $9,000 | $166,690 | $45,230 | $121,460 |
| 2018 | $9,063 | $166,690 | $45,230 | $121,460 |
| 2017 | $9,063 | $166,690 | $45,230 | $121,460 |
| 2016 | $9,063 | $166,690 | $45,230 | $121,460 |
| 2015 | $8,380 | $198,570 | $45,610 | $152,960 |
| 2014 | $8,380 | $198,570 | $45,610 | $152,960 |
Source: Public Records
Map
Nearby Homes
- 138 Infield St
- 39 Infield St
- 330 Oakwood St
- 355 Chamberlain Ave
- 385 Chamberlain Ave
- 926 Hart St
- 916 Hart St
- 123 Exeter St
- 245 Indian Ave
- 235 Indian Ave
- 1265 Lindley St
- 5 Stevens St
- 45 Stevens St Unit 2
- 355 Exeter St
- 213 Exeter St
- 219 Exeter St
- 45 Polk St
- 936 Lindley St
- 25 Broadway
- 500 Woodlawn Avenue Extension