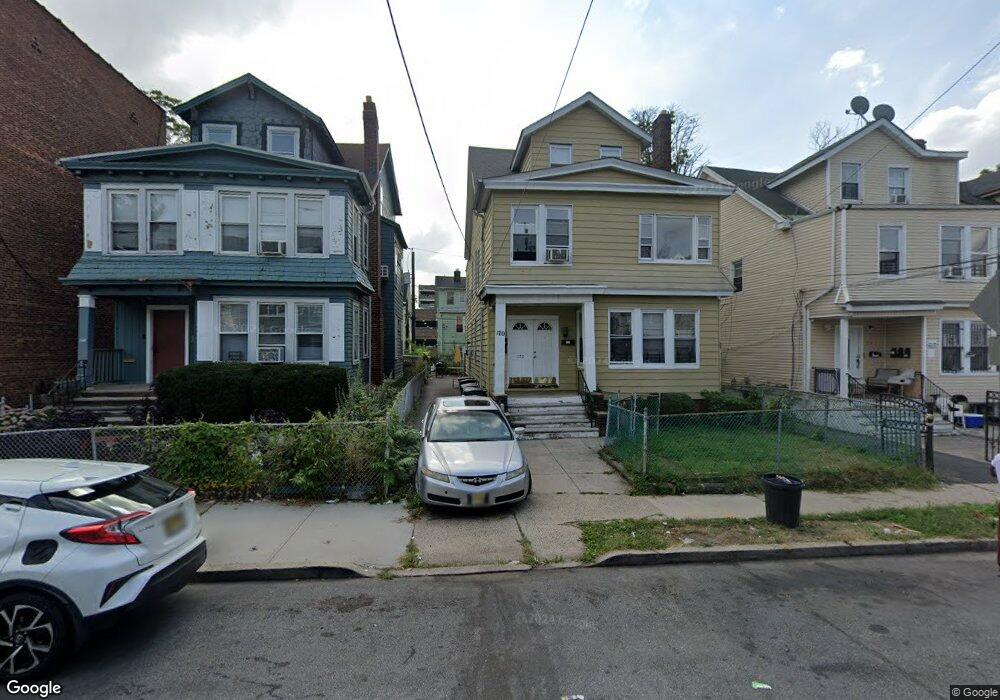
170 Mapes Ave Unit 2 Newark, NJ 07112
Weequahic NeighborhoodEstimated Value: $740,297 - $851,000
4
Beds
1
Bath
4,190
Sq Ft
$188/Sq Ft
Est. Value
About This Home
This home is located at 170 Mapes Ave Unit 2, Newark, NJ 07112 and is currently estimated at $789,074, approximately $188 per square foot. 170 Mapes Ave Unit 2 is a home located in Essex County with nearby schools including Peshine Avenue Elementary School, Chancellor Avenue School, and Hawthorne Avenue Elementary School.
Ownership History
Date
Name
Owned For
Owner Type
Purchase Details
Closed on
Oct 12, 2021
Sold by
Mapes Three Llc
Bought by
Bisnauth Everard Jamel and Pope Ernest
Current Estimated Value
Home Financials for this Owner
Home Financials are based on the most recent Mortgage that was taken out on this home.
Original Mortgage
$520,400
Outstanding Balance
$474,556
Interest Rate
2.8%
Mortgage Type
FHA
Estimated Equity
$314,518
Purchase Details
Closed on
May 8, 2017
Sold by
Kenmore Two Llc
Bought by
Mapes Three Llc
Purchase Details
Closed on
Feb 23, 2017
Sold by
Beatty Renne M
Bought by
Kenmore Two L
Purchase Details
Closed on
Sep 24, 2007
Sold by
Booker Correan
Bought by
Beatty Renee M
Home Financials for this Owner
Home Financials are based on the most recent Mortgage that was taken out on this home.
Original Mortgage
$285,519
Interest Rate
6.65%
Mortgage Type
FHA
Create a Home Valuation Report for This Property
The Home Valuation Report is an in-depth analysis detailing your home's value as well as a comparison with similar homes in the area
Home Values in the Area
Average Home Value in this Area
Purchase History
| Date | Buyer | Sale Price | Title Company |
|---|---|---|---|
| Bisnauth Everard Jamel | $530,000 | None Available | |
| Mapes Three Llc | -- | None Available | |
| Kenmore Two L | $155,000 | Foundation Title | |
| Beatty Renee M | $290,000 | Chicago Title Insurance Co |
Source: Public Records
Mortgage History
| Date | Status | Borrower | Loan Amount |
|---|---|---|---|
| Open | Bisnauth Everard Jamel | $520,400 | |
| Previous Owner | Beatty Renee M | $285,519 |
Source: Public Records
Tax History
| Year | Tax Paid | Tax Assessment Tax Assessment Total Assessment is a certain percentage of the fair market value that is determined by local assessors to be the total taxable value of land and additions on the property. | Land | Improvement |
|---|---|---|---|---|
| 2025 | $13,489 | $354,700 | $28,800 | $325,900 |
| 2024 | $13,223 | $354,700 | $28,800 | $325,900 |
| 2023 | $4,670 | $354,700 | $28,800 | $325,900 |
| 2022 | $4,670 | $125,000 | $28,800 | $96,200 |
| 2021 | $4,668 | $125,000 | $28,800 | $96,200 |
| 2020 | $4,750 | $125,000 | $28,800 | $96,200 |
| 2019 | $6,988 | $185,800 | $28,800 | $157,000 |
| 2018 | $6,862 | $185,800 | $28,800 | $157,000 |
| 2017 | $6,614 | $185,800 | $28,800 | $157,000 |
| 2016 | $6,392 | $185,800 | $28,800 | $157,000 |
| 2015 | $6,148 | $185,800 | $28,800 | $157,000 |
| 2014 | $5,762 | $185,800 | $28,800 | $157,000 |
Source: Public Records
Map
Nearby Homes
- 195 Lehigh Ave
- 349 Osborne Terrace Unit 351
- 349-351 Osborne Terrace
- 148 Shephard Ave
- 216 Renner Ave
- 7 Mapes Terrace
- 225 Renner Ave Unit 227
- 135 Scheerer Ave
- 319 Renner Ave
- 203 Schuyler Ave
- 388 Seymour Ave
- 107 Huntington Terrace
- 105 Huntington Terrace Unit 107
- 100 Lyons Ave Unit 2
- 167 Goodwin Ave
- 1075 Bergen St
- 24-26 Irving Ave
- 24 Irving Ave Unit 26
- 1041 Hunterdon St
- 67 Parkview Terrace Unit 69
- 170 Mapes Ave Unit 3
- 170 Mapes Ave Unit 172
- 170-172 Mapes Ave
- 174 Mapes Ave
- 168 Mapes Ave
- 176 Mapes Ave
- 178 Mapes Ave Unit 180
- 177 Lehigh Ave
- 171 Lehigh Ave
- 173 Lehigh Ave Unit 175
- 179 Lehigh Ave
- 167 Lehigh Ave Unit 169
- 182 Mapes Ave Unit 3
- 182 Mapes Ave
- 181 Lehigh Ave Unit 183
- 160 Mapes Ave
- 169 Mapes Ave Unit 171
- 173 Mapes Ave
- 163 Lehigh Ave Unit 165
- 167 Mapes Ave
Your Personal Tour Guide
Ask me questions while you tour the home.