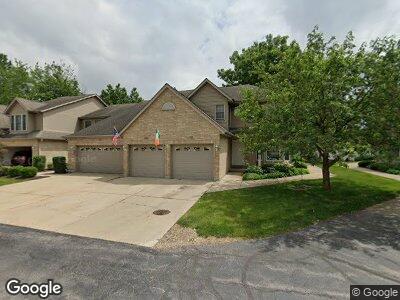
170 Mclaren Dr S Unit 1 Sycamore, IL 60178
Estimated Value: $227,754 - $246,000
3
Beds
2
Baths
1,508
Sq Ft
$157/Sq Ft
Est. Value
About This Home
This home is located at 170 Mclaren Dr S Unit 1, Sycamore, IL 60178 and is currently estimated at $236,439, approximately $156 per square foot. 170 Mclaren Dr S Unit 1 is a home located in DeKalb County with nearby schools including Sycamore High School, St Mary's Catholic School, and Cornerstone Christian Academy.
Ownership History
Date
Name
Owned For
Owner Type
Purchase Details
Closed on
Dec 5, 2018
Sold by
Chicago Title Land Trust Co
Bought by
Bollinger Steven R and Bollinger Beth A
Current Estimated Value
Home Financials for this Owner
Home Financials are based on the most recent Mortgage that was taken out on this home.
Original Mortgage
$84,000
Outstanding Balance
$56,115
Interest Rate
4.8%
Mortgage Type
Future Advance Clause Open End Mortgage
Estimated Equity
$176,145
Purchase Details
Closed on
Oct 26, 2006
Sold by
Bollinger Steven R
Bought by
American Natl Bank Dekalb
Purchase Details
Closed on
Jun 1, 2005
Sold by
Stark Anthony Michael
Bought by
Bollinger Steven R and Bollinger Beth A
Home Financials for this Owner
Home Financials are based on the most recent Mortgage that was taken out on this home.
Original Mortgage
$117,000
Interest Rate
5.91%
Mortgage Type
New Conventional
Create a Home Valuation Report for This Property
The Home Valuation Report is an in-depth analysis detailing your home's value as well as a comparison with similar homes in the area
Home Values in the Area
Average Home Value in this Area
Purchase History
| Date | Buyer | Sale Price | Title Company |
|---|---|---|---|
| Bollinger Steven R | -- | None Available | |
| American Natl Bank Dekalb | -- | -- | |
| Bollinger Steven R | $145,000 | -- |
Source: Public Records
Mortgage History
| Date | Status | Borrower | Loan Amount |
|---|---|---|---|
| Open | Bollinger Steven R | $84,000 | |
| Previous Owner | Bollinger Steven R | $117,000 | |
| Previous Owner | Stark Anthony Michael | $113,500 |
Source: Public Records
Tax History Compared to Growth
Tax History
| Year | Tax Paid | Tax Assessment Tax Assessment Total Assessment is a certain percentage of the fair market value that is determined by local assessors to be the total taxable value of land and additions on the property. | Land | Improvement |
|---|---|---|---|---|
| 2024 | $5,361 | $64,894 | $11,384 | $53,510 |
| 2023 | $5,361 | $59,258 | $10,395 | $48,863 |
| 2022 | $5,151 | $54,350 | $9,534 | $44,816 |
| 2021 | $4,318 | $44,757 | $8,950 | $35,807 |
| 2020 | $4,265 | $43,657 | $8,730 | $34,927 |
| 2019 | $4,203 | $42,701 | $8,539 | $34,162 |
| 2018 | $4,140 | $41,405 | $8,280 | $33,125 |
| 2017 | $4,051 | $39,766 | $7,952 | $31,814 |
| 2016 | $3,967 | $37,952 | $7,589 | $30,363 |
| 2015 | -- | $35,720 | $7,143 | $28,577 |
| 2014 | -- | $37,485 | $8,586 | $28,899 |
| 2013 | -- | $38,203 | $8,750 | $29,453 |
Source: Public Records
Map
Nearby Homes
- 146 Mclaren Dr S Unit 2D
- 520 S Main St
- 446 Somonauk St
- 333 E Cloverlane Dr
- 644 South Ave
- 322 W High St
- 431 Edward St
- 1128 Somonauk St
- 927 Greenleaf St
- 332 E Ottawa St
- 220 S Maple St
- 524 S Cross St
- 1039 Greenleaf St
- 1125 Juniper Dr
- 424 Washington Place
- 714 Dekalb Ave
- Lot 1 Route 23
- 435 Mary Ann Cir
- 1119 Parkside Dr
- 211 Leah Ct
- 170 Mclaren Dr S Unit 3F
- 170 Mclaren Dr S Unit 1
- 166 Mclaren Dr S Unit 3D
- 168 Mclaren Dr S Unit 4
- 164 Mclaren Dr S Unit 3C
- 162 Mclaren Dr S Unit 3B
- 160 Mclaren Dr S Unit 3A
- 125 W Turner Place
- 121 W Turner Place
- 180 Mclaren Dr S Unit 4A
- 182 Mclaren Dr S Unit 4B
- 184 Mclaren Dr S Unit 4C
- 186 Mclaren Dr S Unit 4D
- 188 Mclaren Dr S Unit 4F
- 117 W Turner Place
- 190 Mclaren Dr S Unit 4E
- 189 Mclaren Dr N Unit 5A
- 189 Mclaren Dr N Unit 189
- 150 Mclaren Dr S Unit 2E
- 204 W Turner Place