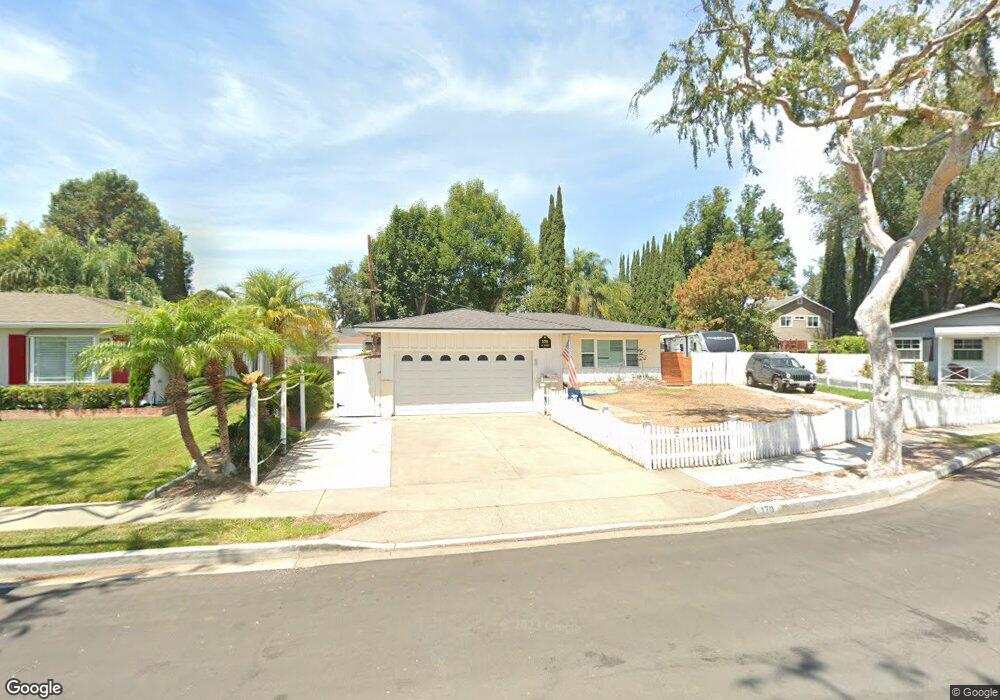
170 N D St Tustin, CA 92780
Estimated Value: $940,238 - $1,133,000
3
Beds
2
Baths
1,332
Sq Ft
$790/Sq Ft
Est. Value
About This Home
This home is located at 170 N D St, Tustin, CA 92780 and is currently estimated at $1,052,310, approximately $790 per square foot. 170 N D St is a home located in Orange County with nearby schools including Helen Estock Elementary School, Columbus Tustin Middle School, and Foothill High School.
Ownership History
Date
Name
Owned For
Owner Type
Purchase Details
Closed on
Sep 18, 2019
Sold by
Hurtado Matthew A
Bought by
Hurtado Matthew A
Current Estimated Value
Home Financials for this Owner
Home Financials are based on the most recent Mortgage that was taken out on this home.
Original Mortgage
$344,000
Interest Rate
3.4%
Mortgage Type
New Conventional
Purchase Details
Closed on
Jun 14, 2013
Sold by
Hurtado Rainee R and Hurtado Matthew A
Bought by
Hurtado Matthew A
Purchase Details
Closed on
Sep 28, 2006
Sold by
Remp David P
Bought by
Hurtado Matthew A and Hurtado Rainee R
Home Financials for this Owner
Home Financials are based on the most recent Mortgage that was taken out on this home.
Original Mortgage
$520,000
Interest Rate
6.75%
Mortgage Type
Purchase Money Mortgage
Purchase Details
Closed on
Dec 13, 2005
Sold by
Remp David P
Bought by
Remp David P
Purchase Details
Closed on
Oct 28, 1996
Sold by
Remp Paul W
Bought by
Remp Paul W and The Paul Remp Family Trust
Create a Home Valuation Report for This Property
The Home Valuation Report is an in-depth analysis detailing your home's value as well as a comparison with similar homes in the area
Home Values in the Area
Average Home Value in this Area
Purchase History
| Date | Buyer | Sale Price | Title Company |
|---|---|---|---|
| Hurtado Matthew A | -- | Stewart Title Guaranty Co | |
| Hurtado Matthew A | -- | Stewart Title Guaranty Co | |
| Hurtado Matthew A | -- | None Available | |
| Hurtado Matthew A | -- | Fidelity National Title Co | |
| Remp David P | -- | -- | |
| Remp Paul W | -- | -- |
Source: Public Records
Mortgage History
| Date | Status | Borrower | Loan Amount |
|---|---|---|---|
| Closed | Hurtado Matthew A | $344,000 | |
| Closed | Hurtado Matthew A | $520,000 |
Source: Public Records
Tax History
| Year | Tax Paid | Tax Assessment Tax Assessment Total Assessment is a certain percentage of the fair market value that is determined by local assessors to be the total taxable value of land and additions on the property. | Land | Improvement |
|---|---|---|---|---|
| 2025 | $4,029 | $335,451 | $257,826 | $77,625 |
| 2024 | $4,029 | $328,874 | $252,771 | $76,103 |
| 2023 | $3,924 | $322,426 | $247,815 | $74,611 |
| 2022 | $3,858 | $316,104 | $242,955 | $73,149 |
| 2021 | $3,783 | $309,906 | $238,191 | $71,715 |
| 2020 | $3,763 | $306,729 | $235,749 | $70,980 |
| 2019 | $3,676 | $300,715 | $231,126 | $69,589 |
| 2018 | $3,618 | $294,819 | $226,594 | $68,225 |
| 2017 | $3,557 | $289,039 | $222,151 | $66,888 |
| 2016 | $3,496 | $283,372 | $217,795 | $65,577 |
| 2015 | $3,573 | $279,116 | $214,524 | $64,592 |
| 2014 | $3,485 | $273,649 | $210,322 | $63,327 |
Source: Public Records
Map
Nearby Homes
- 119 Jessup Way
- 17926 Irvine Blvd
- 17732 Amaganset Way
- 428 W 1st St
- 17956 Irvine Blvd
- 601 Handley Ct
- 1042 San Juan St
- 2171 Lemon Heights
- 14272 Acacia Dr
- 14372 Livingston St
- 13431 Elizabeth Way
- 16865 Donwest Unit 71
- 16869 Donwest
- 14162 Prospect Ave
- 39 Via Entrada
- 148 Balsawood
- 153 Balsawood
- 17782 Arbolada Way
- 152 Balsawood
- 17965 Wellington Ave
- 160 N D St
- 115 Orangewood Ln
- 165 N C St
- 173 N C St
- 163 N C St
- 125 Orangewood Ln
- 175 N C St
- 130 Orangewood Ln
- 155 N C St
- 110 Lockwood Park Place
- 140 N D St
- 135 Orangewood Ln
- 183 N C St
- 153 N C St
- 140 Orangewood Ln
- 130 Lockwood Park Place
- 17802 Irvine Blvd
- 17802 Irvine Blvd Unit 119
- 145 Orangewood Ln
- 145 N C St
Your Personal Tour Guide
Ask me questions while you tour the home.