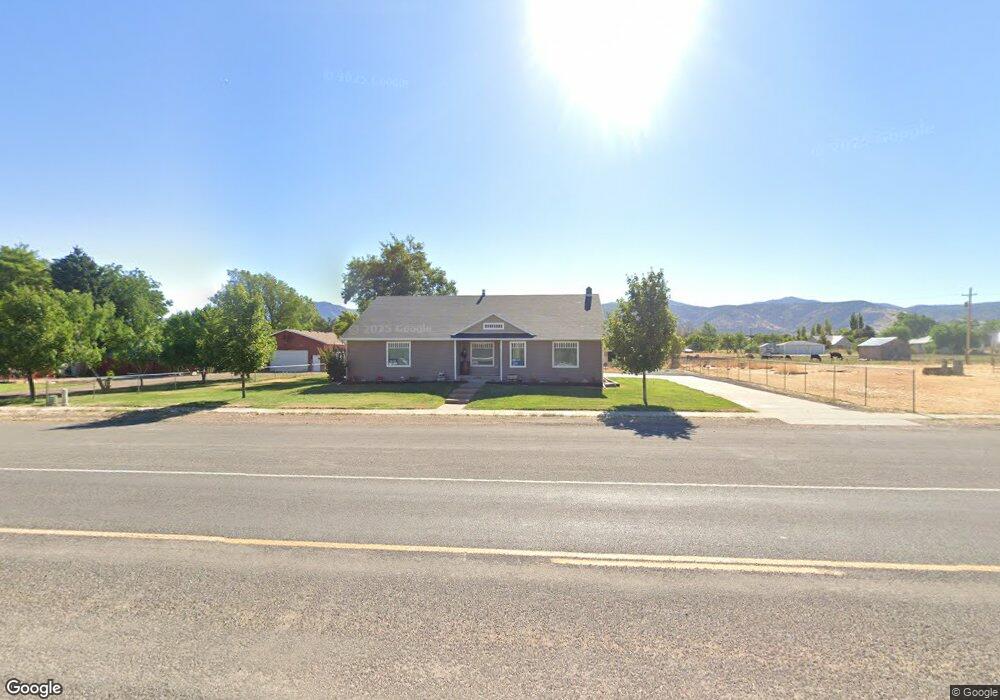
170 N Main St Kanosh, UT 84637
Estimated Value: $335,000 - $485,079
3
Beds
3
Baths
2,976
Sq Ft
$144/Sq Ft
Est. Value
About This Home
This home is located at 170 N Main St, Kanosh, UT 84637 and is currently estimated at $429,270, approximately $144 per square foot. 170 N Main St is a home located in Millard County.
Ownership History
Date
Name
Owned For
Owner Type
Purchase Details
Closed on
May 15, 2025
Sold by
Higgs Jared and Higgs Michelle
Bought by
Higgs
Current Estimated Value
Purchase Details
Closed on
Aug 13, 2012
Sold by
Federal Home Loan Mortgage Corporation
Bought by
Higgs Jared and Higgs Michelle
Home Financials for this Owner
Home Financials are based on the most recent Mortgage that was taken out on this home.
Original Mortgage
$173,469
Interest Rate
3.63%
Mortgage Type
New Conventional
Purchase Details
Closed on
Apr 30, 2012
Sold by
Halliday Paul M and Peterson Michael C
Bought by
Federal Home Loan Mortgage Corp
Purchase Details
Closed on
Dec 1, 2006
Sold by
The Corn Creek Irrigation Company
Bought by
Peterson Michael C and Peterson Cameronne L
Home Financials for this Owner
Home Financials are based on the most recent Mortgage that was taken out on this home.
Original Mortgage
$120,000
Interest Rate
6.32%
Mortgage Type
Purchase Money Mortgage
Create a Home Valuation Report for This Property
The Home Valuation Report is an in-depth analysis detailing your home's value as well as a comparison with similar homes in the area
Home Values in the Area
Average Home Value in this Area
Purchase History
| Date | Buyer | Sale Price | Title Company |
|---|---|---|---|
| Higgs | -- | None Listed On Document | |
| Higgs | -- | None Listed On Document | |
| Higgs Jared | -- | First American Title Insuran | |
| Federal Home Loan Mortgage Corp | $187,030 | -- | |
| Peterson Michael C | -- | -- | |
| Peterson Michael C | -- | -- | |
| Christensen Steven Leavitt | -- | -- |
Source: Public Records
Mortgage History
| Date | Status | Borrower | Loan Amount |
|---|---|---|---|
| Previous Owner | Higgs Jared | $173,469 | |
| Previous Owner | Christensen Steven Leavitt | $120,000 |
Source: Public Records
Tax History Compared to Growth
Tax History
| Year | Tax Paid | Tax Assessment Tax Assessment Total Assessment is a certain percentage of the fair market value that is determined by local assessors to be the total taxable value of land and additions on the property. | Land | Improvement |
|---|---|---|---|---|
| 2025 | $1,923 | $251,844 | $31,043 | $220,801 |
| 2024 | $1,923 | $260,341 | $15,642 | $244,699 |
| 2023 | $2,304 | $260,341 | $15,642 | $244,699 |
| 2022 | $1,517 | $142,473 | $12,514 | $129,959 |
| 2021 | $1,498 | $135,723 | $10,881 | $124,842 |
| 2020 | $1,296 | $118,514 | $9,892 | $108,622 |
| 2019 | $1,144 | $105,262 | $9,075 | $96,187 |
| 2018 | $1,131 | $106,550 | $8,250 | $98,300 |
| 2017 | $1,182 | $106,550 | $8,250 | $98,300 |
| 2016 | $1,080 | $101,550 | $6,188 | $95,362 |
| 2015 | $1,080 | $101,550 | $6,188 | $95,362 |
| 2014 | -- | $101,550 | $6,188 | $95,362 |
| 2013 | -- | $101,550 | $6,188 | $95,362 |
Source: Public Records
Map
Nearby Homes
- 135 E 200 N
- 115 W 200 S
- 58 E 300 South St
- 8610 S Highway 91
- 5098 W Hatton Rd
- Parcel # 8816
- 60 W Center St
- 145 N 200 E
- 50 N 100 Rd E
- 1565 W Sunflower Ln Unit 3
- 1615 W Sunflower Ln
- 1615 W Sunflower Ln Unit 4
- 1565 W Sunflower Ln
- 2000 N West Frontage I-15
- 0 Tbd Black Rock Rd Unit LotWP001
- 1100 S 725 Rd W
- 310 S 500 West Rd
- 190 W 400 St S
- 760 E 700 St S
- 155 E 500 St S