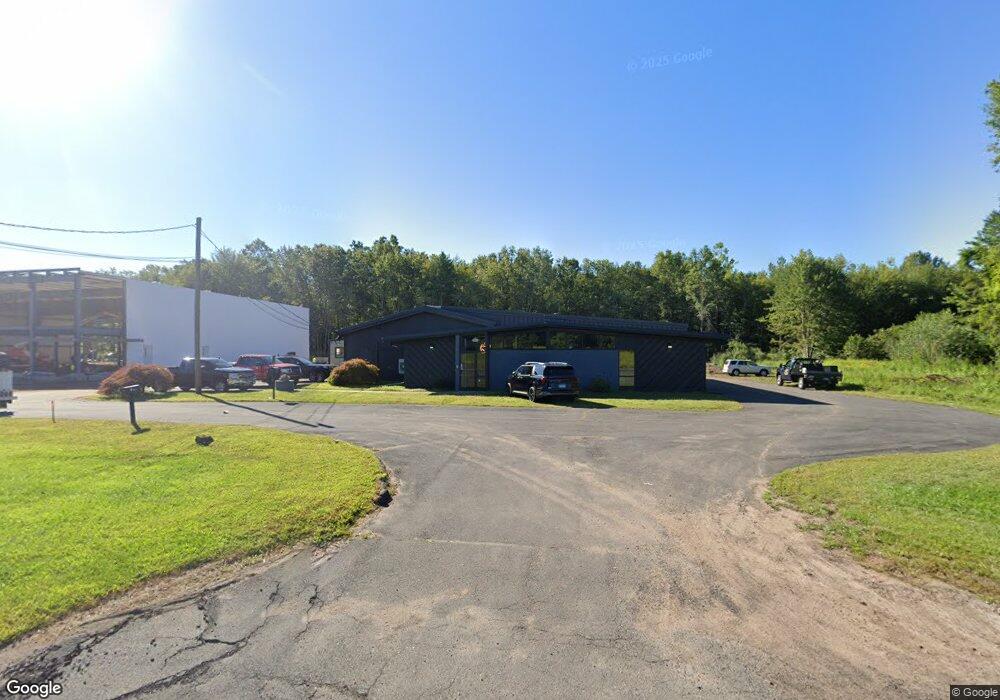
170 North Rd East Windsor, CT 06088
--
Bed
--
Bath
5,017
Sq Ft
0.93
Acres
About This Home
This home is located at 170 North Rd, East Windsor, CT 06088. 170 North Rd is a home located in Hartford County with nearby schools including Broad Brook Elementary School, East Windsor Middle School, and East Windsor High School.
Ownership History
Date
Name
Owned For
Owner Type
Purchase Details
Closed on
Jul 26, 2021
Sold by
Elegant Clinical Corp
Bought by
Leason David
Purchase Details
Closed on
Sep 11, 2015
Sold by
Schiavone Realty Hldg
Bought by
Elegant Clinical Corp
Purchase Details
Closed on
May 19, 2011
Sold by
Schiavone Daniel T
Bought by
Schiavone Realty Holdi
Create a Home Valuation Report for This Property
The Home Valuation Report is an in-depth analysis detailing your home's value as well as a comparison with similar homes in the area
Home Values in the Area
Average Home Value in this Area
Purchase History
| Date | Buyer | Sale Price | Title Company |
|---|---|---|---|
| Leason David | $300,000 | None Available | |
| Leason David | $300,000 | None Available | |
| Elegant Clinical Corp | $289,000 | -- | |
| Elegant Clinical Corp | $289,000 | -- | |
| Schiavone Realty Holdi | -- | -- | |
| Schiavone Realty Holdi | -- | -- |
Source: Public Records
Mortgage History
| Date | Status | Borrower | Loan Amount |
|---|---|---|---|
| Previous Owner | Schiavone Realty Holdi | $90,000 | |
| Previous Owner | Schiavone Realty Holdi | $100,000 |
Source: Public Records
Tax History Compared to Growth
Tax History
| Year | Tax Paid | Tax Assessment Tax Assessment Total Assessment is a certain percentage of the fair market value that is determined by local assessors to be the total taxable value of land and additions on the property. | Land | Improvement |
|---|---|---|---|---|
| 2025 | $7,234 | $273,090 | $89,690 | $183,400 |
| 2024 | $6,707 | $273,090 | $89,690 | $183,400 |
| 2023 | $8,031 | $234,270 | $61,520 | $172,750 |
| 2022 | $8,054 | $234,270 | $61,520 | $172,750 |
| 2021 | $8,082 | $234,270 | $61,520 | $172,750 |
| 2020 | $8,134 | $234,270 | $61,520 | $172,750 |
| 2019 | $7,596 | $221,790 | $61,520 | $160,270 |
| 2018 | $7,519 | $221,790 | $61,520 | $160,270 |
| 2017 | $7,077 | $215,970 | $61,520 | $154,450 |
| 2016 | $6,680 | $215,970 | $61,520 | $154,450 |
| 2015 | $6,546 | $215,970 | $61,520 | $154,450 |
| 2014 | $6,432 | $215,970 | $61,520 | $154,450 |
Source: Public Records
Map
Nearby Homes