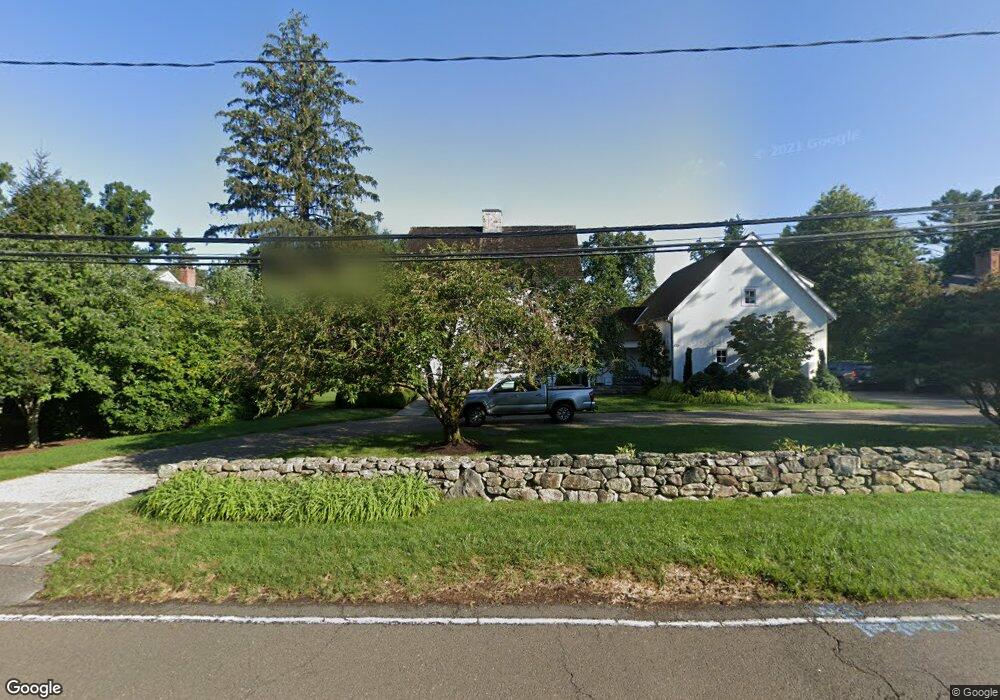
170 Pear Tree Point Rd Darien, CT 06820
Estimated Value: $2,886,000 - $6,303,298
4
Beds
3
Baths
5,568
Sq Ft
$904/Sq Ft
Est. Value
About This Home
This home is located at 170 Pear Tree Point Rd, Darien, CT 06820 and is currently estimated at $5,031,825, approximately $903 per square foot. 170 Pear Tree Point Rd is a home with nearby schools including Tokeneke Elementary School, Middlesex Middle School, and Darien High School.
Ownership History
Date
Name
Owned For
Owner Type
Purchase Details
Closed on
Mar 7, 2024
Sold by
Mcnear John W and Mcnear Catherine S
Bought by
Mcnear Catherine S
Current Estimated Value
Purchase Details
Closed on
Jul 14, 2020
Sold by
Saunders David C
Bought by
Mcnear John W and Mcnear Catherine S
Purchase Details
Closed on
Nov 9, 2000
Sold by
Gabauer A George
Bought by
Mcnear John W and Mcnear Catherine S
Purchase Details
Closed on
Jul 9, 1999
Sold by
George Gebauer T and George Gebauer A
Bought by
Gebauer A George
Create a Home Valuation Report for This Property
The Home Valuation Report is an in-depth analysis detailing your home's value as well as a comparison with similar homes in the area
Home Values in the Area
Average Home Value in this Area
Purchase History
| Date | Buyer | Sale Price | Title Company |
|---|---|---|---|
| Mcnear Catherine S | -- | None Available | |
| Mcnear Catherine S | -- | None Available | |
| Mcnear John W | -- | None Available | |
| Mcnear John W | -- | None Available | |
| Mcnear John W | $1,425,000 | -- | |
| Gebauer A George | $461,028 | -- | |
| Mcnear John W | $1,425,000 | -- | |
| Gebauer A George | $461,028 | -- |
Source: Public Records
Mortgage History
| Date | Status | Borrower | Loan Amount |
|---|---|---|---|
| Previous Owner | Gebauer A George | $3,000,000 | |
| Previous Owner | Gebauer A George | $3,000,000 | |
| Previous Owner | Gebauer A George | $1,975,000 |
Source: Public Records
Tax History Compared to Growth
Tax History
| Year | Tax Paid | Tax Assessment Tax Assessment Total Assessment is a certain percentage of the fair market value that is determined by local assessors to be the total taxable value of land and additions on the property. | Land | Improvement |
|---|---|---|---|---|
| 2025 | $49,934 | $3,225,740 | $2,021,880 | $1,203,860 |
| 2024 | $47,386 | $3,225,740 | $2,021,880 | $1,203,860 |
| 2023 | $44,186 | $2,509,150 | $1,444,170 | $1,064,980 |
| 2022 | $43,233 | $2,509,150 | $1,444,170 | $1,064,980 |
| 2021 | $42,254 | $2,509,150 | $1,444,170 | $1,064,980 |
| 2020 | $40,253 | $2,464,980 | $1,400,000 | $1,064,980 |
| 2019 | $40,598 | $2,464,980 | $1,400,000 | $1,064,980 |
| 2018 | $35,334 | $2,197,370 | $1,134,000 | $1,063,370 |
| 2017 | $6,172 | $2,197,370 | $1,134,000 | $1,063,370 |
| 2016 | $34,653 | $2,197,370 | $1,134,000 | $1,063,370 |
| 2015 | $32,364 | $2,108,400 | $1,134,000 | $974,400 |
| 2014 | $31,647 | $2,108,400 | $1,134,000 | $974,400 |
Source: Public Records
Map
Nearby Homes
- 74 Long Neck Point Rd
- 92 Pear Tree Point Rd
- 88 Pear Tree Point Rd
- 5 Mayflower Rd
- 5 Shipway Rd
- 28 Aquila Rd
- 53 Noroton Ave
- 33 Dora St
- 86 Wallacks Dr
- 16 Neponsit St
- 55 Avery St
- 120 Webb Ave
- 214 Seaside Ave
- 214 Seaside Ave Unit 2
- 209 Seaside Ave Unit 2
- 15 Robin St
- 105 Houston Terrace
- 175 Seaside Ave Unit 1
- 114 Sylvan Knoll Rd
- 17 Contentment Island Rd
- 171 Pear Tree Point Rd
- 166 Pear Tree Point Rd
- 180 Pear Tree Point Rd
- 158 Long Neck Point Rd
- 159 Pear Tree Point Rd
- 156 Pear Tree Point Rd
- 140 Long Neck Point Rd
- 150 Pear Tree Point Rd
- 18 Crane Rd
- 17 Crane Rd
- 130 Long Neck Point Rd
- 163 Pear Tree Point Rd
- 160 Long Neck Point Rd
- 155 Pear Tree Point Rd
- 15 Crane Rd
- 14 Crane Rd
- 78 Long Neck Point Rd
- 147 Long Neck Point Rd
- 136 Pear Tree Point Rd
- 120 Long Neck Point Rd