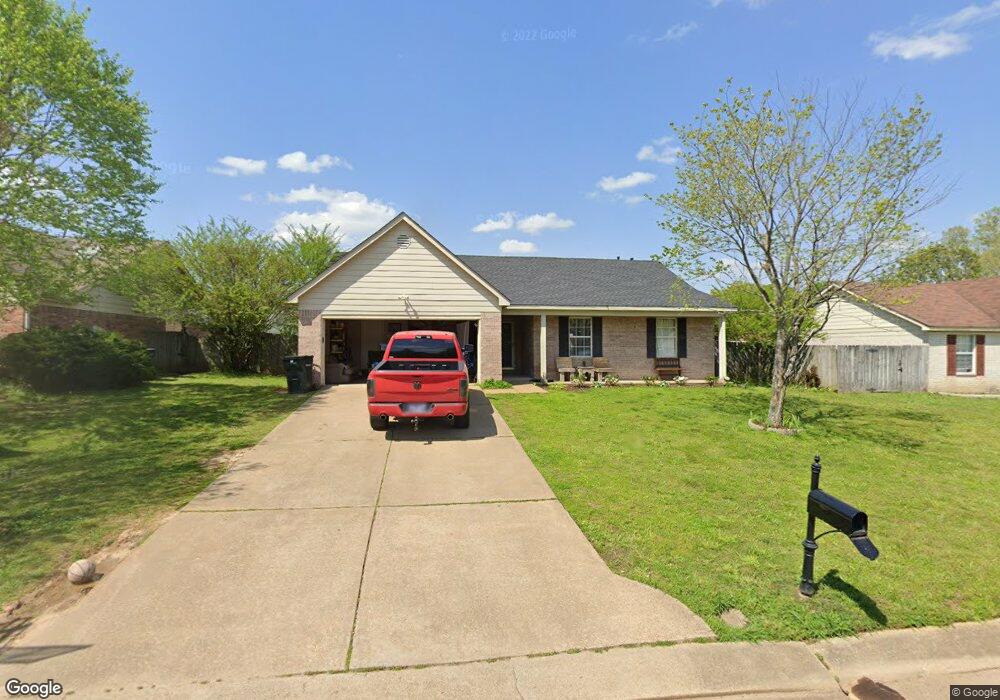
170 Pine Ridge Ln Oakland, TN 38060
Estimated Value: $234,000 - $274,000
3
Beds
2
Baths
1,285
Sq Ft
$198/Sq Ft
Est. Value
About This Home
This home is located at 170 Pine Ridge Ln, Oakland, TN 38060 and is currently estimated at $254,953, approximately $198 per square foot. 170 Pine Ridge Ln is a home located in Fayette County with nearby schools including Oakland Elementary School, West Junior High School, and Fayette Ware Comprehensive High School.
Ownership History
Date
Name
Owned For
Owner Type
Purchase Details
Closed on
Apr 13, 2011
Bought by
Lambert Shelby Denise
Current Estimated Value
Purchase Details
Closed on
Jul 21, 2010
Sold by
Lamb Kathy
Bought by
Household Financial Center Inc
Purchase Details
Closed on
Oct 2, 2006
Sold by
Bingle Jack
Bought by
Lamb Kathy
Home Financials for this Owner
Home Financials are based on the most recent Mortgage that was taken out on this home.
Original Mortgage
$140,000
Interest Rate
9.7%
Mortgage Type
New Conventional
Purchase Details
Closed on
Feb 4, 2004
Sold by
Bingle Carolyn
Bought by
Bingle Jack
Home Financials for this Owner
Home Financials are based on the most recent Mortgage that was taken out on this home.
Original Mortgage
$119,770
Interest Rate
6.07%
Purchase Details
Closed on
Nov 18, 2003
Bought by
Bingle Jack and Bingle Carolyn
Purchase Details
Closed on
May 30, 2000
Sold by
Crossman Communities
Bought by
Johnson Carolyn
Create a Home Valuation Report for This Property
The Home Valuation Report is an in-depth analysis detailing your home's value as well as a comparison with similar homes in the area
Home Values in the Area
Average Home Value in this Area
Purchase History
| Date | Buyer | Sale Price | Title Company |
|---|---|---|---|
| Lambert Shelby Denise | $107,000 | -- | |
| Household Financial Center Inc | $91,260 | -- | |
| Household Financial Center Inc | $91,260 | -- | |
| Lamb Kathy | $140,000 | -- | |
| Bingle Jack | $125,000 | -- | |
| Bingle Jack | $125,000 | -- | |
| Johnson Carolyn | $120,000 | -- |
Source: Public Records
Mortgage History
| Date | Status | Borrower | Loan Amount |
|---|---|---|---|
| Previous Owner | Johnson Carolyn | $140,000 | |
| Previous Owner | Johnson Carolyn | $119,770 |
Source: Public Records
Tax History Compared to Growth
Tax History
| Year | Tax Paid | Tax Assessment Tax Assessment Total Assessment is a certain percentage of the fair market value that is determined by local assessors to be the total taxable value of land and additions on the property. | Land | Improvement |
|---|---|---|---|---|
| 2024 | $998 | $38,650 | $8,750 | $29,900 |
| 2023 | $998 | $38,650 | $0 | $0 |
| 2022 | $662 | $38,650 | $8,750 | $29,900 |
| 2021 | $662 | $38,650 | $8,750 | $29,900 |
| 2020 | $475 | $38,650 | $8,750 | $29,900 |
| 2019 | $639 | $31,500 | $7,500 | $24,000 |
| 2018 | $658 | $31,500 | $7,500 | $24,000 |
| 2017 | $560 | $31,500 | $7,500 | $24,000 |
| 2016 | $561 | $29,475 | $7,500 | $21,975 |
| 2015 | $561 | $29,475 | $7,500 | $21,975 |
| 2014 | $561 | $29,475 | $7,500 | $21,975 |
Source: Public Records
Map
Nearby Homes
- 65 Maple Run Dr
- 85 Oakcrest Dr
- 235 Oakland Hills Dr
- 25 Norma Carol Cove
- 75 Norma Carol Cove
- 115 Norma Carol Cove
- 60 Umble St
- 245 Oaks Edge
- 50 Umble St
- 65 Cleer Ave
- 30 Wild Oak Dr
- 190 Hughetta St S
- 200 Hughetta St S
- 300 Cherokee Cir
- 195 Chickasaw Trace Dr
- 205 Hughetta St S
- 80 Burr Oak Cove
- 195 Hughetta St S
- 110 Blue St
- 75 Burr Oak Cove
- 180 Pine Ridge Ln
- 160 Pine Ridge Ln
- 110 Pine Ridge Ln
- 25 Pine Ridge Cove
- 35 Pine Ridge Cove
- 190 Pine Ridge Ln
- 175 Pine Ridge Ln
- 45 Pine Ridge Cove
- 185 Pine Ridge Ln
- 165 Pine Ridge Ln
- 195 Pine Ridge Ln
- 210 Pine Ridge Ln
- 155 Pine Ridge Ln
- 95 Pinewood Dr
- 145 Pine Ridge Ln
- 115 Pine Ridge Ln
- 40 Pine Ridge Cove
- 105 Pine Ridge Ln
- 125 Pine Ridge Ln
- 85 Pinewood Dr