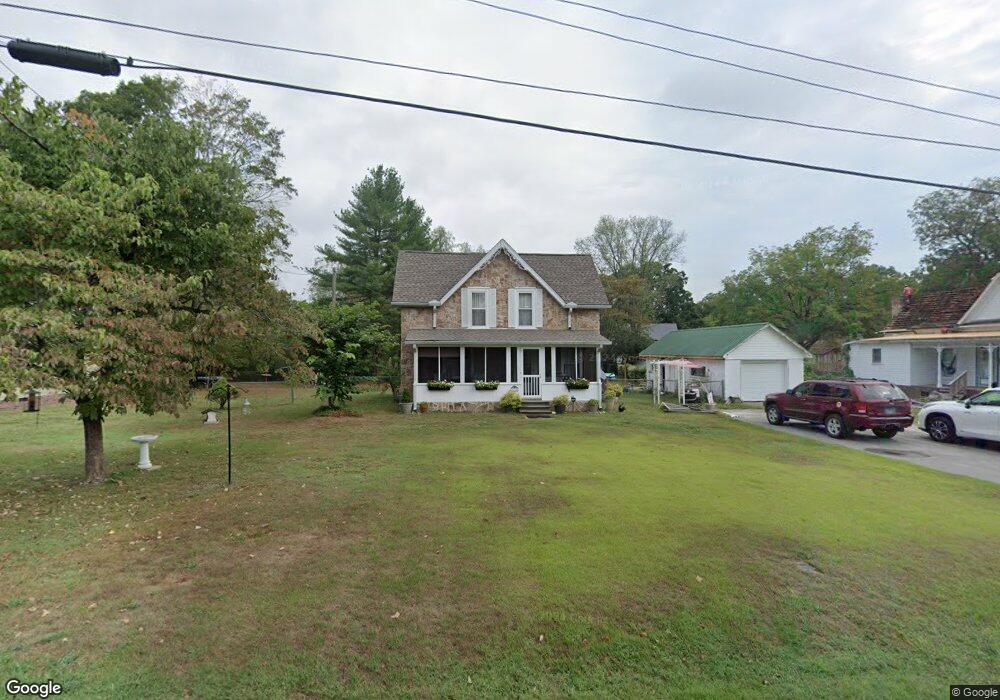
170 Pocahontas Ave Spring City, TN 37381
Estimated Value: $155,502 - $211,000
--
Bed
2
Baths
1,134
Sq Ft
$155/Sq Ft
Est. Value
About This Home
This home is located at 170 Pocahontas Ave, Spring City, TN 37381 and is currently estimated at $175,626, approximately $154 per square foot. 170 Pocahontas Ave is a home located in Rhea County with nearby schools including Rhea County High School, King Memorial Seventh Day Adve, and Spring City Christian Academy.
Ownership History
Date
Name
Owned For
Owner Type
Purchase Details
Closed on
Jul 9, 1996
Sold by
Millichamp George F
Bought by
Loggins Lisa S
Current Estimated Value
Purchase Details
Closed on
Jun 15, 1993
Bought by
Loggins Lisa S and Loggins Frances B
Purchase Details
Closed on
May 3, 1975
Bought by
Millichamp George F and Millichamp Frances B
Create a Home Valuation Report for This Property
The Home Valuation Report is an in-depth analysis detailing your home's value as well as a comparison with similar homes in the area
Home Values in the Area
Average Home Value in this Area
Purchase History
| Date | Buyer | Sale Price | Title Company |
|---|---|---|---|
| Loggins Lisa S | -- | -- | |
| Loggins Lisa S | -- | -- | |
| Millichamp George F | -- | -- |
Source: Public Records
Tax History Compared to Growth
Tax History
| Year | Tax Paid | Tax Assessment Tax Assessment Total Assessment is a certain percentage of the fair market value that is determined by local assessors to be the total taxable value of land and additions on the property. | Land | Improvement |
|---|---|---|---|---|
| 2024 | -- | $42,550 | $4,625 | $37,925 |
| 2023 | $690 | $18,050 | $2,300 | $15,750 |
| 2022 | $681 | $18,050 | $2,300 | $15,750 |
| 2021 | $669 | $18,050 | $2,300 | $15,750 |
| 2020 | $607 | $18,050 | $2,300 | $15,750 |
| 2019 | $607 | $18,050 | $2,300 | $15,750 |
| 2018 | $476 | $14,400 | $1,700 | $12,700 |
| 2017 | $425 | $14,400 | $1,700 | $12,700 |
| 2016 | $450 | $14,250 | $2,475 | $11,775 |
| 2015 | $436 | $14,250 | $2,475 | $11,775 |
| 2014 | $299 | $14,250 | $2,475 | $11,775 |
| 2013 | -- | $14,250 | $2,475 | $11,775 |
Source: Public Records
Map
Nearby Homes
- 498 W Rhea Ave
- 676 W Rhea Ave
- 491 Piccadilly Ave
- 393 Pocahontas Ave
- 229 Pierce St
- 000 Wassom Memorial Hwy
- 281 Ketchersid Ave
- 225 Spring St
- 229 Pierce Hill Rd
- 229 Pierce Hill St
- 0 Bayshore Dr Unit SPRING CITY TN 37381
- 107 &149 E Jackson Ave
- 107 E Jackson Ave
- 174 E Jackson Ave
- 277 Cemetery Rd
- 0 Beach Rd Unit RTC2986615
- 0 Beach Rd Unit 1508308
- Lot 33 Hinch St
- Lot 32 Hinch St
- Lot351-354 Diana Dr
- 180 Pocahontas Ave
- 192 Pocahontas Ave
- 140 Pocahontas Ave
- 587 W Jackson Ave
- 605 W Jackson Ave
- 181 Pocahontas Ave
- 165 Pocahontas Ave
- 559 W Jackson Ave
- 627 W Jackson Ave
- 207 Pocahontas Ave
- 139 Pocahontas Ave
- 242 Pocahontas Ave
- 215 Pocahontas Ave
- 639 W Jackson Ave
- 105 Lavender St
- 548 W Rhea Ave
- 532 W Rhea Ave
- 564 W Rhea Ave
- 156 Lavender St
- 510 W Rhea Ave