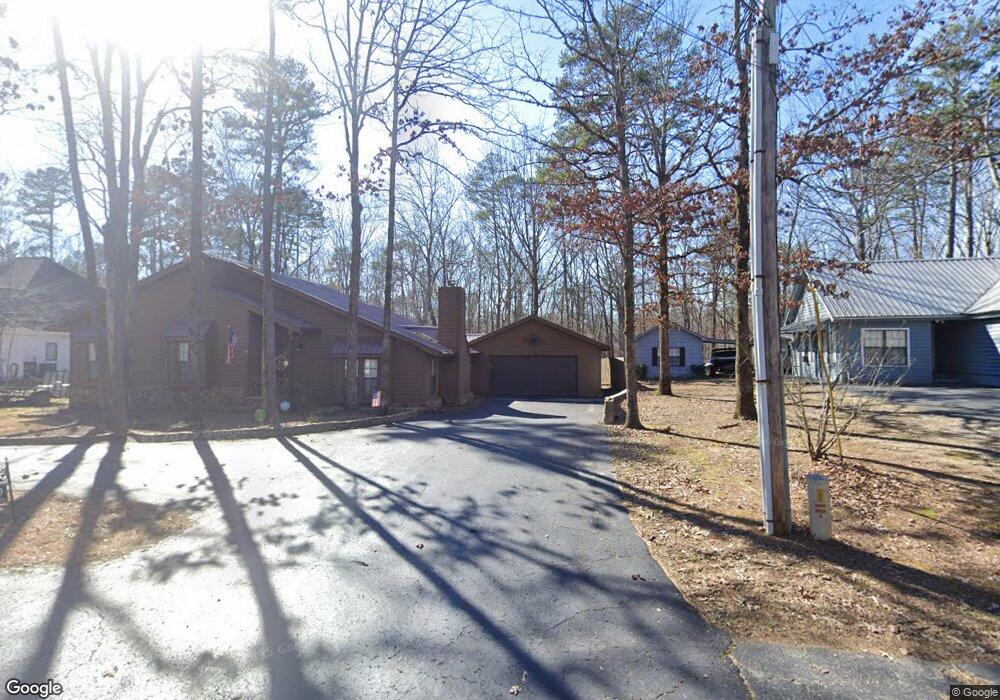
170 Roberts Ln Counce, TN 38326
Estimated Value: $190,000 - $333,000
--
Bed
2
Baths
1,404
Sq Ft
$186/Sq Ft
Est. Value
About This Home
This home is located at 170 Roberts Ln, Counce, TN 38326 and is currently estimated at $261,533, approximately $186 per square foot. 170 Roberts Ln is a home located in Hardin County with nearby schools including Hardin County High School.
Ownership History
Date
Name
Owned For
Owner Type
Purchase Details
Closed on
Dec 19, 2007
Sold by
Gordon Alfred C
Bought by
Bohannon John
Current Estimated Value
Home Financials for this Owner
Home Financials are based on the most recent Mortgage that was taken out on this home.
Original Mortgage
$115,200
Outstanding Balance
$74,864
Interest Rate
6.15%
Estimated Equity
$186,669
Purchase Details
Closed on
Dec 27, 2004
Sold by
Jolly Robert W
Bought by
Gordon Alfred C
Purchase Details
Closed on
Feb 20, 1996
Bought by
Jolly Robert W
Purchase Details
Closed on
Jun 18, 1990
Bought by
Meter Gary W Van
Purchase Details
Closed on
Jul 20, 1989
Bought by
Briley & Callens Const Co
Purchase Details
Closed on
Jun 20, 1989
Bought by
Hadley Gerald and Whittington Jame
Purchase Details
Closed on
Sep 23, 1988
Bought by
Briley & Callens Cons'T Co Inc
Purchase Details
Closed on
Aug 7, 1987
Bought by
Hardin County Bank
Purchase Details
Closed on
May 29, 1984
Bought by
Pickens Thomas E
Purchase Details
Closed on
Mar 22, 1983
Create a Home Valuation Report for This Property
The Home Valuation Report is an in-depth analysis detailing your home's value as well as a comparison with similar homes in the area
Home Values in the Area
Average Home Value in this Area
Purchase History
| Date | Buyer | Sale Price | Title Company |
|---|---|---|---|
| Bohannon John | $144,000 | -- | |
| Gordon Alfred C | $119,000 | -- | |
| Jolly Robert W | $76,000 | -- | |
| Meter Gary W Van | -- | -- | |
| Briley & Callens Const Co | -- | -- | |
| Hadley Gerald | -- | -- | |
| Briley & Callens Cons'T Co Inc | -- | -- | |
| Hardin County Bank | -- | -- | |
| Pickens Thomas E | -- | -- | |
| -- | -- | -- |
Source: Public Records
Mortgage History
| Date | Status | Borrower | Loan Amount |
|---|---|---|---|
| Open | Not Available | $115,200 |
Source: Public Records
Tax History Compared to Growth
Tax History
| Year | Tax Paid | Tax Assessment Tax Assessment Total Assessment is a certain percentage of the fair market value that is determined by local assessors to be the total taxable value of land and additions on the property. | Land | Improvement |
|---|---|---|---|---|
| 2024 | $711 | $40,650 | $6,250 | $34,400 |
| 2023 | $711 | $40,650 | $6,250 | $34,400 |
| 2022 | $615 | $29,850 | $4,000 | $25,850 |
| 2021 | $615 | $29,850 | $4,000 | $25,850 |
| 2020 | $615 | $29,850 | $4,000 | $25,850 |
| 2019 | $615 | $29,850 | $4,000 | $25,850 |
| 2018 | $594 | $29,850 | $4,000 | $25,850 |
| 2017 | $575 | $27,625 | $4,000 | $23,625 |
| 2016 | $575 | $27,625 | $4,000 | $23,625 |
| 2015 | $503 | $27,625 | $4,000 | $23,625 |
| 2014 | $503 | $27,625 | $4,000 | $23,625 |
Source: Public Records
Map
Nearby Homes
- 59 Liles Ln
- 74 Backwoods Loop
- 180 Strobbe Ln
- 90 Arabian Ln
- 150 Island View Dr
- 70 Lakeshore Ln
- 6 Legends Dr
- 225 Windy Pines Ln
- 80 Viewpoint Cove
- 80 View Point Cove
- 55 Knotty Oaks Dr
- 75 Grapevine Cove
- 35 Grapevine Cove
- 10 Rising Sun Ln Unit 14
- 10 Rising Sun Ln
- 500 Holiday Hills Ln
- 405 Shipwatch Place
- 165 Lakeshore Ln Unit 1,2,3,4,5,6
- 386 Windwood Point
- 215 Glading Place Ln