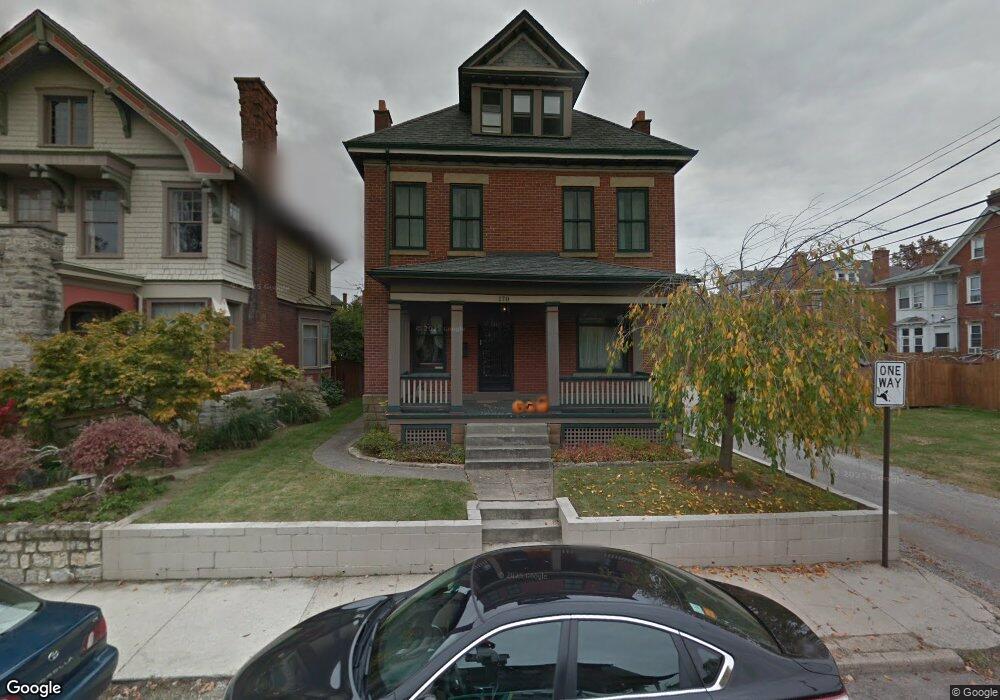
170 S 17th St Columbus, OH 43205
Olde Towne East NeighborhoodEstimated Value: $432,675 - $558,000
5
Beds
2
Baths
2,344
Sq Ft
$203/Sq Ft
Est. Value
About This Home
This home is located at 170 S 17th St, Columbus, OH 43205 and is currently estimated at $474,919, approximately $202 per square foot. 170 S 17th St is a home located in Franklin County with nearby schools including Ohio Avenue Elementary School, Champion Middle School, and East High School.
Ownership History
Date
Name
Owned For
Owner Type
Purchase Details
Closed on
Dec 15, 2018
Sold by
Murphy Sarah J
Bought by
Swank Ryan M
Current Estimated Value
Home Financials for this Owner
Home Financials are based on the most recent Mortgage that was taken out on this home.
Original Mortgage
$275,000
Interest Rate
4.25%
Mortgage Type
Adjustable Rate Mortgage/ARM
Purchase Details
Closed on
Sep 23, 2003
Sold by
Smith Jacqueline L
Bought by
Swank Ryan M and Murphy Sarah J
Home Financials for this Owner
Home Financials are based on the most recent Mortgage that was taken out on this home.
Original Mortgage
$163,161
Interest Rate
6.33%
Mortgage Type
FHA
Purchase Details
Closed on
Dec 30, 1998
Sold by
Estate Of Douglas L Smith
Bought by
Smith Jacqueline L
Purchase Details
Closed on
Mar 21, 1988
Bought by
Smith Douglas L
Create a Home Valuation Report for This Property
The Home Valuation Report is an in-depth analysis detailing your home's value as well as a comparison with similar homes in the area
Home Values in the Area
Average Home Value in this Area
Purchase History
| Date | Buyer | Sale Price | Title Company |
|---|---|---|---|
| Swank Ryan M | -- | None Available | |
| Swank Ryan M | $157,500 | -- | |
| Smith Jacqueline L | -- | -- | |
| Smith Douglas L | $75,000 | -- |
Source: Public Records
Mortgage History
| Date | Status | Borrower | Loan Amount |
|---|---|---|---|
| Previous Owner | Swank Ryan M | $275,000 | |
| Previous Owner | Swank Ryan M | $163,161 |
Source: Public Records
Tax History Compared to Growth
Tax History
| Year | Tax Paid | Tax Assessment Tax Assessment Total Assessment is a certain percentage of the fair market value that is determined by local assessors to be the total taxable value of land and additions on the property. | Land | Improvement |
|---|---|---|---|---|
| 2024 | $4,975 | $110,850 | $35,630 | $75,220 |
| 2023 | $4,911 | $110,850 | $35,630 | $75,220 |
| 2022 | $4,176 | $80,510 | $5,780 | $74,730 |
| 2021 | $4,183 | $80,510 | $5,780 | $74,730 |
| 2020 | $4,134 | $79,460 | $5,780 | $73,680 |
| 2019 | $3,856 | $63,560 | $4,620 | $58,940 |
| 2018 | $3,611 | $63,560 | $4,620 | $58,940 |
| 2017 | $3,853 | $63,560 | $4,620 | $58,940 |
| 2016 | $3,717 | $56,110 | $4,590 | $51,520 |
| 2015 | $3,374 | $56,110 | $4,590 | $51,520 |
| 2014 | $3,382 | $56,110 | $4,590 | $51,520 |
| 2013 | $1,516 | $50,995 | $4,165 | $46,830 |
Source: Public Records
Map
Nearby Homes
- 847 Franklin Ave
- 240-242 S 18th St
- 962 Franklin Ave
- 136 S Garfield Ave
- 972 Franklin Ave
- 977 Bryden Rd
- 263 S 20th St
- 828 E Main St
- 143 S Garfield Ave
- 991 Bryden Rd Unit 993
- 308 Carpenter St
- 41 S Garfield Ave
- 732 Franklin Ave Unit 723
- 726 Franklin Ave
- 1033-1035 Franklin Ave
- 1041 Franklin Ave
- 897 Mcallister Ave
- 940 Mcallister Ave
- 1035 Madison Ave
- 947 Mcallister Ave
- 164 S 17th St
- 160-162 S 17th St
- 160 S 17th St Unit 162
- 154 S 17th St Unit 156
- 852 Bryden Rd Unit 852
- 844 Bryden Rd
- 169 S 18th St Unit 171
- 157 S 17th St
- 144 S 17th St
- 173 S 18th St Unit 175
- 175 S 18th St
- 153 S 17th St Unit 153
- 171 S 177 1 2 S Seventeenth St
- 862 Bryden Rd
- 167 S 18th St
- 165 S 18th St
- 858 Bryden Rd
- 854 Bryden Rd
- 163 S 17th St
- 163 S 17th St Unit 163 S 17th