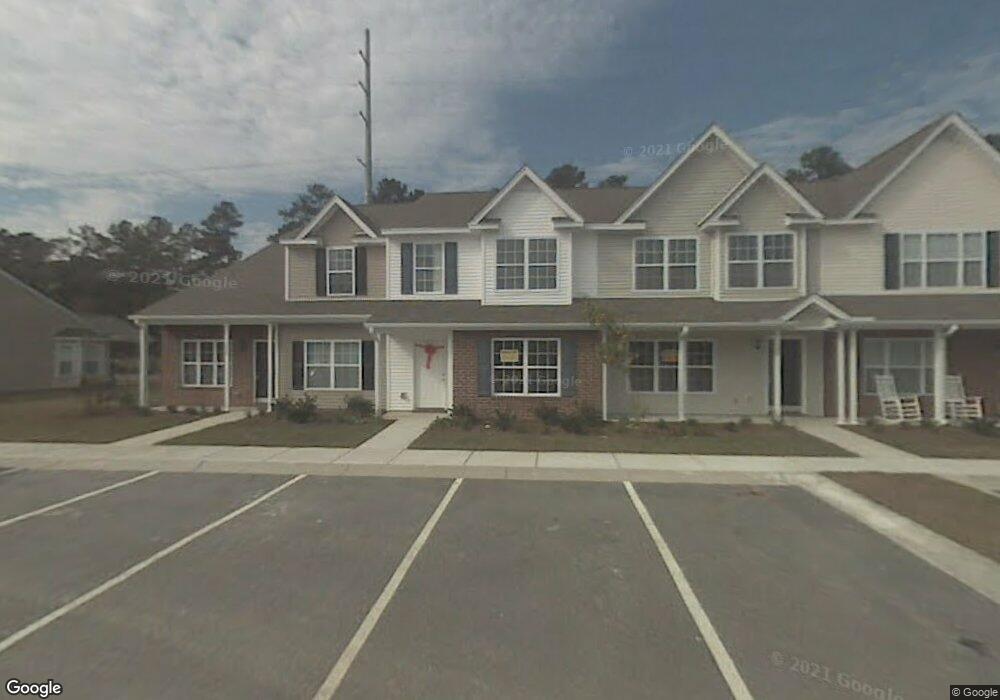
170 Sonata Cir Pooler, GA 31322
Estimated Value: $217,364 - $242,000
2
Beds
3
Baths
1,354
Sq Ft
$170/Sq Ft
Est. Value
About This Home
This home is located at 170 Sonata Cir, Pooler, GA 31322 and is currently estimated at $229,841, approximately $169 per square foot. 170 Sonata Cir is a home located in Chatham County with nearby schools including West Chatham Elementary School, West Chatham Middle School, and New Hampstead High School.
Ownership History
Date
Name
Owned For
Owner Type
Purchase Details
Closed on
May 5, 2017
Sold by
Diane Nettles
Bought by
Allen Vonetta and Harris Cierra
Current Estimated Value
Home Financials for this Owner
Home Financials are based on the most recent Mortgage that was taken out on this home.
Original Mortgage
$84,000
Outstanding Balance
$69,703
Interest Rate
4.02%
Estimated Equity
$160,138
Purchase Details
Closed on
Jun 15, 2015
Sold by
Allen Vonetta C
Bought by
Allen Vonetta C and Harris Cierra C
Purchase Details
Closed on
Mar 22, 2011
Sold by
Krc Harmony Llc
Bought by
Allen Vonetta C
Home Financials for this Owner
Home Financials are based on the most recent Mortgage that was taken out on this home.
Original Mortgage
$62,400
Interest Rate
4.92%
Mortgage Type
New Conventional
Purchase Details
Closed on
Nov 16, 2009
Sold by
Rc Properties Iii Llc
Bought by
Krc Harmony and C/O Conix Llc
Purchase Details
Closed on
Dec 2, 2008
Sold by
Not Provided
Bought by
Allen Vonetta C
Create a Home Valuation Report for This Property
The Home Valuation Report is an in-depth analysis detailing your home's value as well as a comparison with similar homes in the area
Home Values in the Area
Average Home Value in this Area
Purchase History
| Date | Buyer | Sale Price | Title Company |
|---|---|---|---|
| Allen Vonetta | -- | -- | |
| Allen Vonetta C | -- | -- | |
| Allen Vonetta C | $78,000 | -- | |
| Allen Vonetta C | $78,000 | -- | |
| Krc Harmony | $1,450,000 | -- | |
| Allen Vonetta C | -- | -- |
Source: Public Records
Mortgage History
| Date | Status | Borrower | Loan Amount |
|---|---|---|---|
| Open | Allen Vonetta | $84,000 | |
| Closed | Allen Vonetta | -- | |
| Previous Owner | Allen Vonetta C | $62,400 |
Source: Public Records
Tax History
| Year | Tax Paid | Tax Assessment Tax Assessment Total Assessment is a certain percentage of the fair market value that is determined by local assessors to be the total taxable value of land and additions on the property. | Land | Improvement |
|---|---|---|---|---|
| 2025 | $3,258 | $87,600 | $16,000 | $71,600 |
| 2024 | $11 | $91,080 | $16,000 | $75,080 |
| 2023 | $1,066 | $79,280 | $16,000 | $63,280 |
| 2022 | $1,822 | $65,760 | $12,000 | $53,760 |
| 2021 | $1,836 | $53,160 | $7,200 | $45,960 |
| 2020 | $1,689 | $52,640 | $7,200 | $45,440 |
| 2019 | $1,688 | $49,400 | $7,200 | $42,200 |
| 2018 | $1,636 | $47,800 | $7,200 | $40,600 |
| 2017 | $1,454 | $45,400 | $6,960 | $38,440 |
| 2016 | $1,431 | $44,600 | $6,960 | $37,640 |
| 2015 | $808 | $45,400 | $6,960 | $38,440 |
| 2014 | $1,955 | $41,040 | $0 | $0 |
Source: Public Records
Map
Nearby Homes
- 172 Sonata Cir
- 125 Acapella Ave
- 146 Sonata Cir
- 308 Gallery Way
- 100 Sonata Cir
- 204 Opus Ct
- 224 Opus Ct
- 226 Opus Ct
- 18 Stone Gate Ct
- 9 Iron Gate Ct
- 7 Tranquil Place
- 200 Sonoma Dr
- 345 Sonoma Dr
- 116 Ventura Place
- 2 Iron Gate Ct
- 100 Ventura Place
- 200 Harmony Blvd
- 9 Cross Gate Ct
- 17 Olde Gate Ct
- 615 Blue Moon Crossing
Your Personal Tour Guide
Ask me questions while you tour the home.