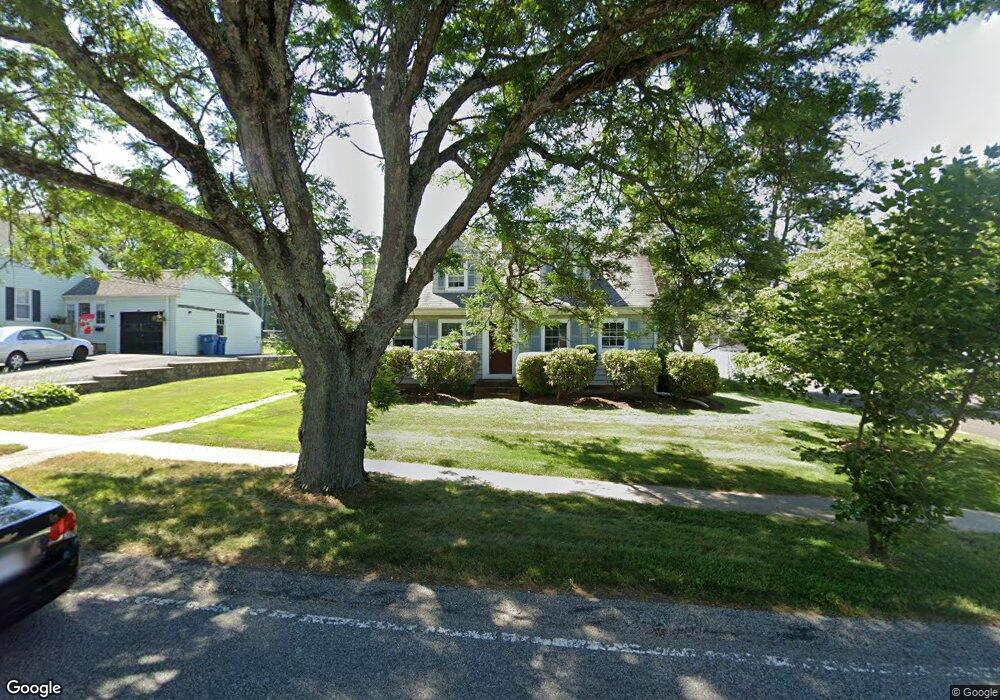
170 W Union St East Bridgewater, MA 02333
Estimated Value: $441,000 - $602,000
4
Beds
2
Baths
1,962
Sq Ft
$270/Sq Ft
Est. Value
About This Home
This home is located at 170 W Union St, East Bridgewater, MA 02333 and is currently estimated at $529,449, approximately $269 per square foot. 170 W Union St is a home located in Plymouth County with nearby schools including Central Elementary School, Gordon W Mitchell Middle School, and East Bridgewater Jr./Sr. High School.
Ownership History
Date
Name
Owned For
Owner Type
Purchase Details
Closed on
Oct 5, 2023
Sold by
Climo Patrick E
Bought by
Climo Patrick E and Lynch Kathleen M
Current Estimated Value
Purchase Details
Closed on
Sep 2, 2009
Sold by
Climo Patrick E and Climo Kathleen A
Bought by
Climo Patrick E
Home Financials for this Owner
Home Financials are based on the most recent Mortgage that was taken out on this home.
Original Mortgage
$100,000
Interest Rate
5.36%
Purchase Details
Closed on
May 2, 1989
Sold by
Trombly Stephen P
Bought by
Climo Patrick E
Home Financials for this Owner
Home Financials are based on the most recent Mortgage that was taken out on this home.
Original Mortgage
$113,000
Interest Rate
10.9%
Mortgage Type
Purchase Money Mortgage
Create a Home Valuation Report for This Property
The Home Valuation Report is an in-depth analysis detailing your home's value as well as a comparison with similar homes in the area
Home Values in the Area
Average Home Value in this Area
Purchase History
| Date | Buyer | Sale Price | Title Company |
|---|---|---|---|
| Climo Patrick E | -- | None Available | |
| Climo Patrick E | -- | None Available | |
| Climo Patrick E | -- | -- | |
| Climo Patrick E | -- | -- | |
| Climo Patrick E | $153,000 | -- |
Source: Public Records
Mortgage History
| Date | Status | Borrower | Loan Amount |
|---|---|---|---|
| Previous Owner | Climo Patrick E | $100,000 | |
| Previous Owner | Climo Patrick E | $94,000 | |
| Previous Owner | Climo Patrick E | $113,000 |
Source: Public Records
Tax History Compared to Growth
Tax History
| Year | Tax Paid | Tax Assessment Tax Assessment Total Assessment is a certain percentage of the fair market value that is determined by local assessors to be the total taxable value of land and additions on the property. | Land | Improvement |
|---|---|---|---|---|
| 2025 | $5,632 | $412,000 | $168,600 | $243,400 |
| 2024 | $5,488 | $396,500 | $162,100 | $234,400 |
| 2023 | $5,526 | $382,400 | $162,100 | $220,300 |
| 2022 | $5,391 | $345,600 | $147,500 | $198,100 |
| 2021 | $5,430 | $318,500 | $141,700 | $176,800 |
| 2020 | $5,305 | $306,800 | $136,300 | $170,500 |
| 2019 | $5,198 | $296,000 | $130,200 | $165,800 |
| 2018 | $3,776 | $283,800 | $130,200 | $153,600 |
| 2017 | $4,989 | $272,600 | $124,200 | $148,400 |
| 2016 | $4,898 | $269,700 | $124,200 | $145,500 |
| 2015 | $4,793 | $269,900 | $123,300 | $146,600 |
| 2014 | $4,765 | $274,300 | $120,700 | $153,600 |
Source: Public Records
Map
Nearby Homes