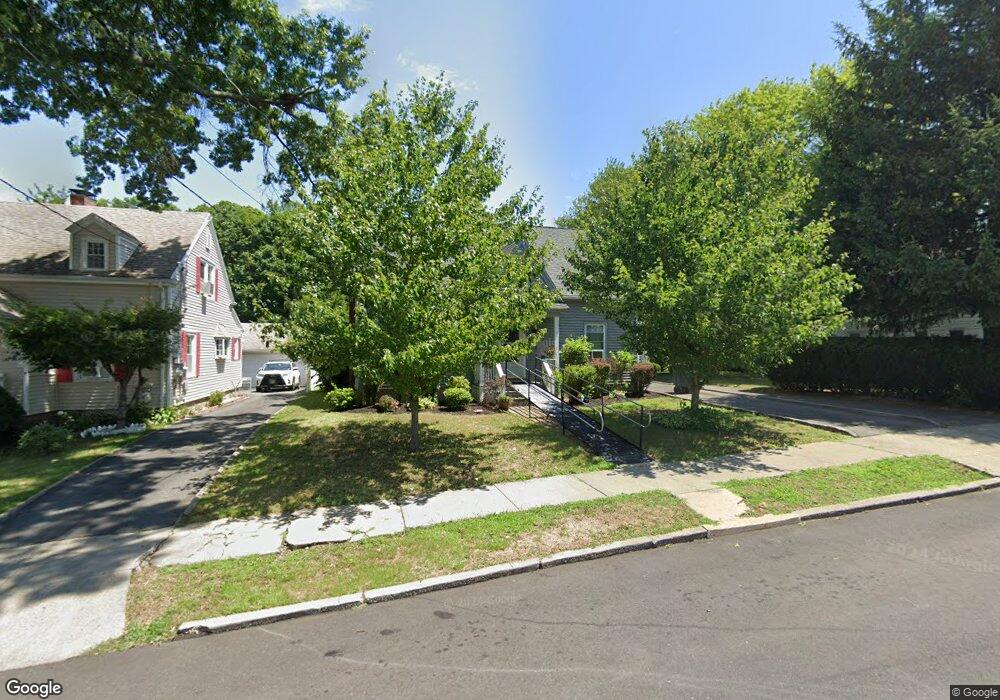
170 Wade St Unit 4 Bridgeport, CT 06604
Brooklawn-Saint Vincent NeighborhoodEstimated Value: $256,848 - $382,000
2
Beds
2
Baths
896
Sq Ft
$338/Sq Ft
Est. Value
About This Home
This home is located at 170 Wade St Unit 4, Bridgeport, CT 06604 and is currently estimated at $302,962, approximately $338 per square foot. 170 Wade St Unit 4 is a home located in Fairfield County with nearby schools including Geraldine Johnson School, Bassick High School, and Catholic Academy of Bridgeport-St. Raphael Academy.
Ownership History
Date
Name
Owned For
Owner Type
Purchase Details
Closed on
Aug 26, 2005
Sold by
Breese Melody
Bought by
Oconnor Patricia
Current Estimated Value
Home Financials for this Owner
Home Financials are based on the most recent Mortgage that was taken out on this home.
Original Mortgage
$205,740
Outstanding Balance
$108,893
Interest Rate
5.68%
Estimated Equity
$194,069
Purchase Details
Closed on
Jul 24, 2003
Sold by
Johns Karen Y
Bought by
Breese Melody E
Home Financials for this Owner
Home Financials are based on the most recent Mortgage that was taken out on this home.
Original Mortgage
$128,250
Interest Rate
5.27%
Purchase Details
Closed on
Oct 14, 1999
Sold by
Elliott Katharine
Bought by
Johns Karen Y
Purchase Details
Closed on
Jul 15, 1996
Sold by
Schless Richard D and Schless Helle L
Bought by
Elliott Katharine
Create a Home Valuation Report for This Property
The Home Valuation Report is an in-depth analysis detailing your home's value as well as a comparison with similar homes in the area
Home Values in the Area
Average Home Value in this Area
Purchase History
| Date | Buyer | Sale Price | Title Company |
|---|---|---|---|
| Oconnor Patricia | $209,000 | -- | |
| Oconnor Patricia | $209,000 | -- | |
| Breese Melody E | $135,000 | -- | |
| Breese Melody E | $135,000 | -- | |
| Johns Karen Y | $88,000 | -- | |
| Johns Karen Y | $88,000 | -- | |
| Elliott Katharine | $60,000 | -- | |
| Elliott Katharine | $60,000 | -- |
Source: Public Records
Mortgage History
| Date | Status | Borrower | Loan Amount |
|---|---|---|---|
| Open | Elliott Katharine | $205,740 | |
| Closed | Elliott Katharine | $205,740 | |
| Previous Owner | Elliott Katharine | $128,250 |
Source: Public Records
Tax History Compared to Growth
Tax History
| Year | Tax Paid | Tax Assessment Tax Assessment Total Assessment is a certain percentage of the fair market value that is determined by local assessors to be the total taxable value of land and additions on the property. | Land | Improvement |
|---|---|---|---|---|
| 2025 | $3,235 | $74,450 | $0 | $74,450 |
| 2024 | $3,235 | $74,450 | $0 | $74,450 |
| 2023 | $3,235 | $74,450 | $0 | $74,450 |
| 2022 | $3,235 | $74,450 | $0 | $74,450 |
| 2021 | $3,235 | $74,450 | $0 | $74,450 |
| 2020 | $3,766 | $69,760 | $0 | $69,760 |
| 2019 | $3,766 | $69,760 | $0 | $69,760 |
| 2018 | $3,793 | $69,760 | $0 | $69,760 |
| 2017 | $3,793 | $69,760 | $0 | $69,760 |
| 2016 | $3,793 | $69,760 | $0 | $69,760 |
| 2015 | $4,484 | $106,260 | $0 | $106,260 |
| 2014 | $4,484 | $106,260 | $0 | $106,260 |
Source: Public Records
Map
Nearby Homes
- 687 Wood Ave
- 1872 North Ave Unit 1874
- 1213 Wood Ave
- 100 Lorraine St
- 356 Taft Ave
- 566 Wood Ave
- 2345 Park Ave
- 1480 Capitol Ave Unit 811
- 90 Sterling Place
- 1275 Capitol Ave
- 605 Brooklawn Ave
- 2445 Park Ave Unit 23
- 2370 North Ave Unit 4C
- 2370 North Ave Unit 10B
- 2370 North Ave Unit 12G
- 2370 North Ave Unit 3F
- 2370 North Ave Unit 5A
- 700 Laurel Ave
- 414 Wood Ave
- 826 Norman St
- 170 Wade St Unit 12
- 170 Wade St Unit 11
- 170 Wade St Unit 10
- 170 Wade St Unit 9
- 170 Wade St Unit 8
- 170 Wade St Unit 7
- 170 Wade St Unit 6
- 170 Wade St Unit 3
- 170 Wade St Unit 2
- 170 Wade St Unit 1
- 160 Wade St Unit 164
- 184 Wade St
- 157 Wade St Unit 157
- 165 Wade St
- 155 Wade St
- 158 Wade St
- 175 Wade St
- 194 Wade St
- 142 Wade St
- 187 Wade St