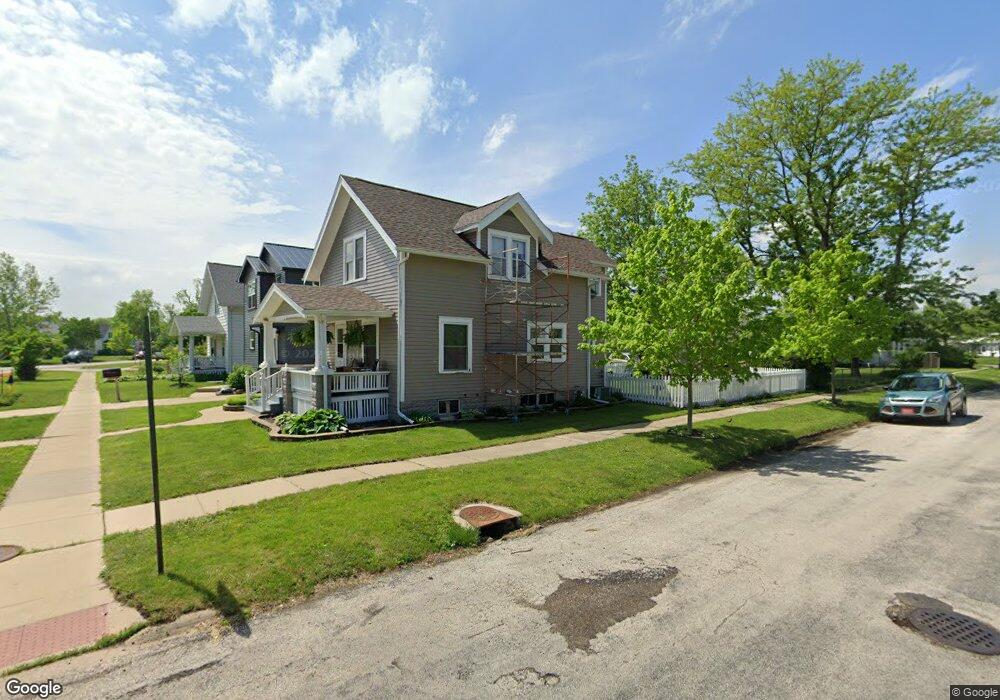
1700 2nd St SW Cedar Rapids, IA 52404
Southwest Area NeighborhoodEstimated Value: $130,000 - $157,000
3
Beds
1
Bath
1,128
Sq Ft
$127/Sq Ft
Est. Value
About This Home
This home is located at 1700 2nd St SW, Cedar Rapids, IA 52404 and is currently estimated at $143,447, approximately $127 per square foot. 1700 2nd St SW is a home located in Linn County with nearby schools including Grant Elementary School, Wilson Middle School, and Thomas Jefferson High School.
Ownership History
Date
Name
Owned For
Owner Type
Purchase Details
Closed on
Nov 23, 1999
Sold by
Linder John C and Estate Of Grace H Linder
Bought by
Stolba Russell and Stolba Linda
Current Estimated Value
Home Financials for this Owner
Home Financials are based on the most recent Mortgage that was taken out on this home.
Original Mortgage
$55,971
Outstanding Balance
$17,283
Interest Rate
7.9%
Mortgage Type
FHA
Estimated Equity
$126,164
Create a Home Valuation Report for This Property
The Home Valuation Report is an in-depth analysis detailing your home's value as well as a comparison with similar homes in the area
Home Values in the Area
Average Home Value in this Area
Purchase History
| Date | Buyer | Sale Price | Title Company |
|---|---|---|---|
| Stolba Russell | $55,500 | -- |
Source: Public Records
Mortgage History
| Date | Status | Borrower | Loan Amount |
|---|---|---|---|
| Open | Stolba Russell | $55,971 |
Source: Public Records
Tax History
| Year | Tax Paid | Tax Assessment Tax Assessment Total Assessment is a certain percentage of the fair market value that is determined by local assessors to be the total taxable value of land and additions on the property. | Land | Improvement |
|---|---|---|---|---|
| 2025 | $1,790 | $124,000 | $23,500 | $100,500 |
| 2024 | $2,114 | $117,400 | $19,100 | $98,300 |
| 2023 | $2,114 | $118,600 | $17,400 | $101,200 |
| 2022 | $1,884 | $109,100 | $17,400 | $91,700 |
| 2021 | $1,838 | $99,900 | $17,400 | $82,500 |
| 2020 | $1,838 | $91,900 | $17,400 | $74,500 |
| 2019 | $1,626 | $84,000 | $12,200 | $71,800 |
Source: Public Records
Map
Nearby Homes
- 1829 J St SW
- 179 15th Ave SW
- 1906 K St SW
- 2021 Hamilton St SW
- 91 Wilson Ave SW
- 1435 N St SW
- 1300 M St SW
- 348 24th Ave SW
- 804 N St SW
- 702 L St SW
- 2461 Teresa Dr SW
- 2430 Linwood St SW
- 329 12th Ave SE
- 648 22nd Ave SW
- 460 9th Ave SW
- 900 2nd St SE Unit 204
- 812 16th Ave SW
- 452 8th Ave SW
- 116 6th Ave SW
- 525 2nd St SW
- 1702 2nd St SW
- 1704 2nd St SW
- 1701 I St SW
- 1624 2nd St SW
- 204 17th Ave SW
- 206 17th Ave SW
- 1733 2nd St SW
- 198 17th Ave SW
- 210 17th Ave SW
- 209 18th Ave SW
- 214 17th Ave SW
- 1801 I St SW
- 1800 2nd St SW
- 190 17th Ave SW
- 1621 2nd St SW
- 1805 I St SW
- 1705 2nd St SW
- 1717 2nd St SW
- 1808 2nd St SW
- 1721 2nd St SW
Your Personal Tour Guide
Ask me questions while you tour the home.