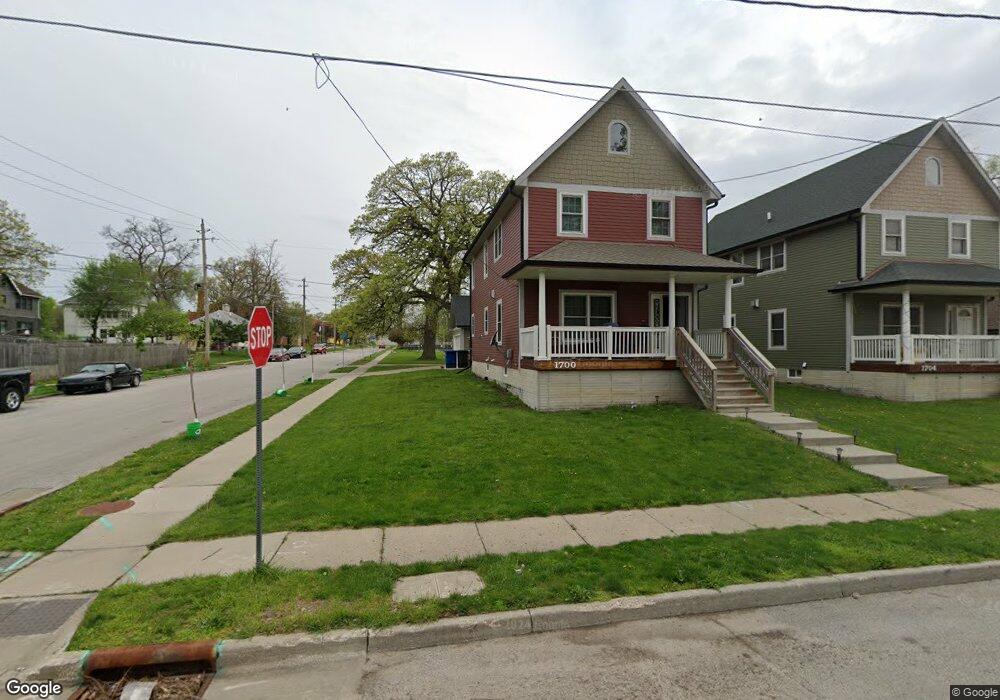
1700 8th St Des Moines, IA 50314
River Bend NeighborhoodEstimated Value: $213,000 - $262,000
3
Beds
3
Baths
1,600
Sq Ft
$147/Sq Ft
Est. Value
About This Home
This home is located at 1700 8th St, Des Moines, IA 50314 and is currently estimated at $235,667, approximately $147 per square foot. 1700 8th St is a home with nearby schools including Moulton Elementary School, Harding Middle School, and North High School.
Ownership History
Date
Name
Owned For
Owner Type
Purchase Details
Closed on
May 11, 2016
Sold by
River Bend Association Inc
Bought by
Caselli Holdings Inc
Current Estimated Value
Purchase Details
Closed on
Oct 4, 2007
Sold by
Hydra Distributing Inc
Bought by
River Bend Assn
Purchase Details
Closed on
Jun 14, 2007
Sold by
Pack Fred Lewis
Bought by
Hydra Distributing Inc
Create a Home Valuation Report for This Property
The Home Valuation Report is an in-depth analysis detailing your home's value as well as a comparison with similar homes in the area
Home Values in the Area
Average Home Value in this Area
Purchase History
| Date | Buyer | Sale Price | Title Company |
|---|---|---|---|
| Caselli Holdings Inc | $10,000 | None Available | |
| River Bend Assn | $2,500 | None Available | |
| Hydra Distributing Inc | -- | None Available |
Source: Public Records
Tax History Compared to Growth
Tax History
| Year | Tax Paid | Tax Assessment Tax Assessment Total Assessment is a certain percentage of the fair market value that is determined by local assessors to be the total taxable value of land and additions on the property. | Land | Improvement |
|---|---|---|---|---|
| 2025 | $1,654 | $250,200 | $7,100 | $243,100 |
| 2024 | $1,654 | $84,080 | $5,480 | $78,600 |
| 2023 | $642 | $223,700 | $6,300 | $217,400 |
| 2022 | $638 | $166,900 | $4,900 | $162,000 |
| 2021 | $170 | $166,900 | $4,900 | $162,000 |
| 2020 | $176 | $146,400 | $4,300 | $142,100 |
| 2019 | $88 | $146,400 | $4,300 | $142,100 |
| 2018 | $3,028 | $142,900 | $4,100 | $138,800 |
| 2017 | $82 | $113,800 | $3,300 | $110,500 |
| 2016 | $80 | $3,000 | $3,000 | $0 |
| 2015 | $80 | $3,000 | $3,000 | $0 |
| 2014 | $138 | $3,200 | $3,200 | $0 |
Source: Public Records
Map
Nearby Homes