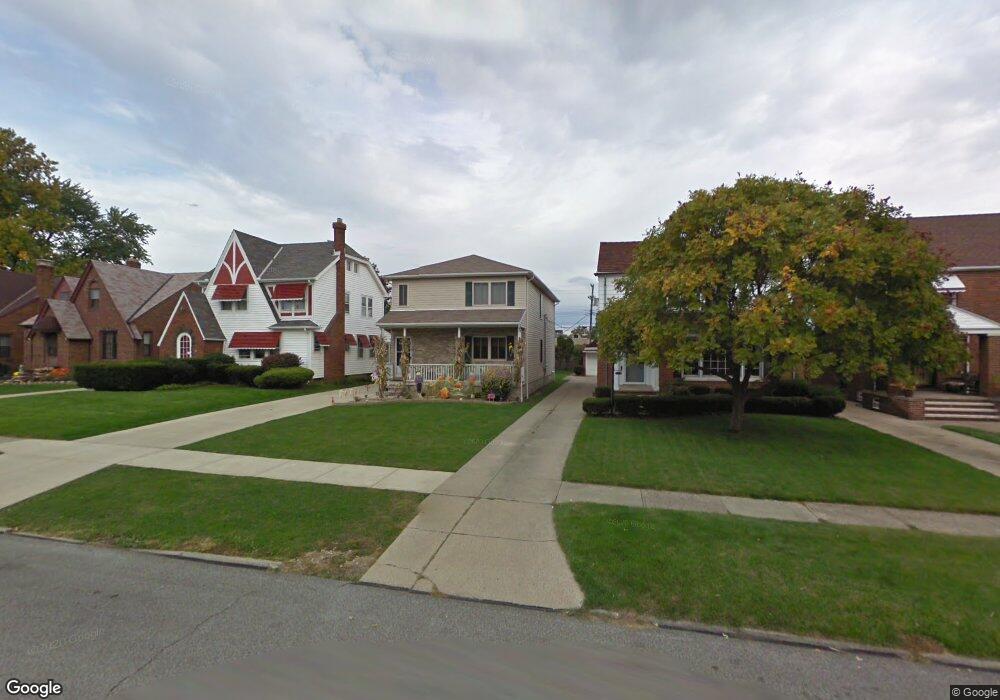
1700 Brookview Blvd Cleveland, OH 44134
Estimated Value: $240,000 - $286,000
4
Beds
2
Baths
2,256
Sq Ft
$119/Sq Ft
Est. Value
About This Home
This home is located at 1700 Brookview Blvd, Cleveland, OH 44134 and is currently estimated at $267,686, approximately $118 per square foot. 1700 Brookview Blvd is a home located in Cuyahoga County with nearby schools including John Muir Elementary School, Hillside Middle School, and Normandy High School.
Ownership History
Date
Name
Owned For
Owner Type
Purchase Details
Closed on
May 4, 2020
Sold by
Sokol Mathew and Sokol Betty J
Bought by
Jaycox Shawn J
Current Estimated Value
Home Financials for this Owner
Home Financials are based on the most recent Mortgage that was taken out on this home.
Original Mortgage
$145,604
Outstanding Balance
$129,195
Interest Rate
3.37%
Mortgage Type
FHA
Estimated Equity
$138,491
Purchase Details
Closed on
Dec 20, 2000
Sold by
Sokol Matthew
Bought by
Sokol Matthew and Sokol Betty J
Purchase Details
Closed on
Nov 16, 2000
Sold by
Higey Lonnie and Higey Sharon
Bought by
Sokol Matthew
Purchase Details
Closed on
Dec 15, 1999
Sold by
Lechak Jeffrey J and Lechak Karen A
Bought by
Higey Lonnie and Higey Sharon
Purchase Details
Closed on
Dec 15, 1993
Sold by
Haddad Amelia
Bought by
Lechak Jeffrey J
Purchase Details
Closed on
Jan 1, 1975
Bought by
Haddad Amelia
Create a Home Valuation Report for This Property
The Home Valuation Report is an in-depth analysis detailing your home's value as well as a comparison with similar homes in the area
Home Values in the Area
Average Home Value in this Area
Purchase History
| Date | Buyer | Sale Price | Title Company |
|---|---|---|---|
| Jaycox Shawn J | $159,000 | Harvard Title Agency | |
| Sokol Matthew | -- | -- | |
| Sokol Matthew | $23,000 | -- | |
| Higey Lonnie | $12,000 | Midland Title Security Inc | |
| Lechak Jeffrey J | -- | -- | |
| Haddad Amelia | -- | -- |
Source: Public Records
Mortgage History
| Date | Status | Borrower | Loan Amount |
|---|---|---|---|
| Open | Jaycox Shawn J | $145,604 |
Source: Public Records
Tax History Compared to Growth
Tax History
| Year | Tax Paid | Tax Assessment Tax Assessment Total Assessment is a certain percentage of the fair market value that is determined by local assessors to be the total taxable value of land and additions on the property. | Land | Improvement |
|---|---|---|---|---|
| 2024 | $5,164 | $84,000 | $11,340 | $72,660 |
| 2023 | $4,098 | $56,040 | $8,750 | $47,290 |
| 2022 | $4,056 | $56,040 | $8,750 | $47,290 |
| 2021 | $4,165 | $56,040 | $8,750 | $47,290 |
| 2020 | $3,734 | $43,090 | $6,720 | $36,370 |
| 2019 | $3,553 | $123,100 | $19,200 | $103,900 |
| 2018 | $3,222 | $43,090 | $6,720 | $36,370 |
| 2017 | $3,182 | $35,390 | $5,530 | $29,860 |
| 2016 | $3,163 | $35,390 | $5,530 | $29,860 |
| 2015 | $2,919 | $35,390 | $5,530 | $29,860 |
| 2014 | $2,919 | $36,130 | $5,640 | $30,490 |
Source: Public Records
Map
Nearby Homes
- 5231 W 16th St
- 1716 Tuxedo Ave
- 2129 North Ave
- 4884 W 13th St
- 4859 W 13th St
- 5085 W 6th St
- 2137 Silverdale Ave
- 5553 Sunset Ln Unit A15-F
- 5554 Landover Ct Unit 282
- 2302 Brookdale Ave
- 5118 W 4th St
- 1917 Alvin Ave
- 4771 S Hills Dr
- 2503 Brookdale Ave
- 2446 Fortune Ave
- 2506 Fortune Ave
- 2712 Ralph Ave
- 2923 Brookview Blvd
- 2831 Walbrook Ave
- 3000 Brookpark Rd Unit R10
- 1618 Brookview Blvd
- 1706 Brookview Blvd
- 1614 Brookview Blvd
- 1710 Brookview Blvd
- 1714 Brookview Blvd
- 5228 W 16th St
- 5224 W 16th St
- 1718 Brookview Blvd
- 5232 W 16th St
- 5220 W 16th St
- 5216 W 16th St
- 1722 Brookview Blvd
- 1703 Brookview Blvd
- 1619 Brookview Blvd
- 1611 Brookview Blvd
- 1707 Brookview Blvd
- 1615 Brookview Blvd
- 1726 Brookview Blvd
- 1715 Brookview Blvd
- 1723 Brookpark Rd