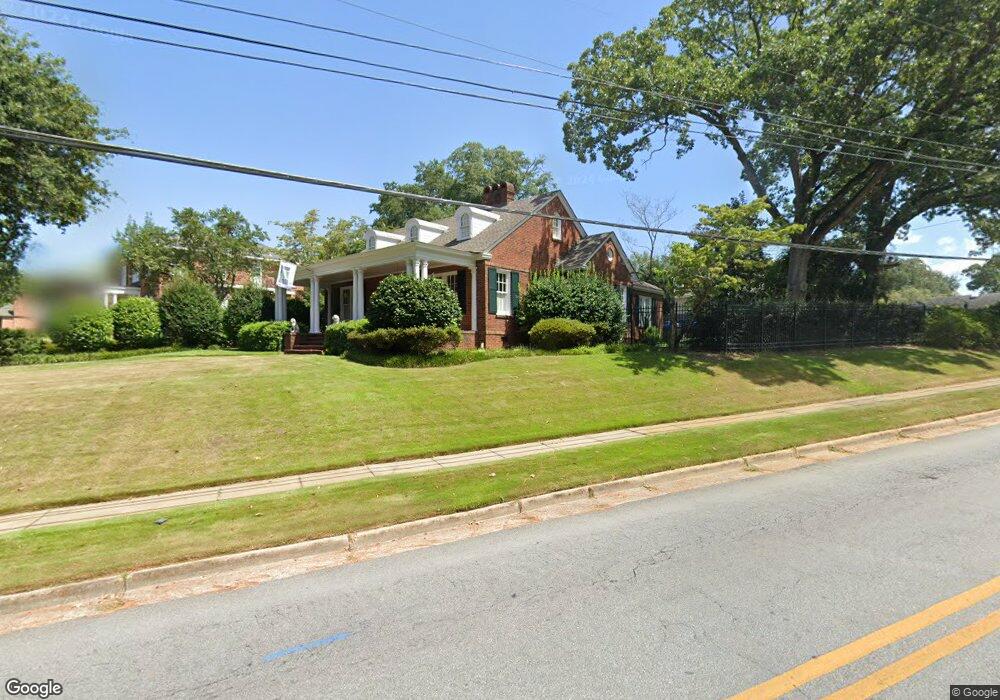
1700 Carter Ave Columbus, GA 31906
Wynnton Grove NeighborhoodEstimated Value: $497,665 - $608,000
4
Beds
4
Baths
3,536
Sq Ft
$152/Sq Ft
Est. Value
About This Home
This home is located at 1700 Carter Ave, Columbus, GA 31906 and is currently estimated at $539,166, approximately $152 per square foot. 1700 Carter Ave is a home located in Muscogee County with nearby schools including Richards Middle School, Hardaway High School, and Wynnton Elementary School.
Ownership History
Date
Name
Owned For
Owner Type
Purchase Details
Closed on
Sep 15, 2020
Sold by
Leatherwood Brett R
Bought by
Peebles Richard C and Peebles Susan B
Current Estimated Value
Purchase Details
Closed on
Aug 19, 2019
Sold by
Goos Michael D
Bought by
Leatherwood Brett R and Leatherwood Elizabeth L
Home Financials for this Owner
Home Financials are based on the most recent Mortgage that was taken out on this home.
Original Mortgage
$318,986
Interest Rate
4.5%
Mortgage Type
FHA
Purchase Details
Closed on
Apr 11, 2014
Sold by
Gaffney Edward J
Bought by
Goos Michael D and Goos Paula E
Home Financials for this Owner
Home Financials are based on the most recent Mortgage that was taken out on this home.
Original Mortgage
$190,000
Interest Rate
3.46%
Mortgage Type
New Conventional
Create a Home Valuation Report for This Property
The Home Valuation Report is an in-depth analysis detailing your home's value as well as a comparison with similar homes in the area
Home Values in the Area
Average Home Value in this Area
Purchase History
| Date | Buyer | Sale Price | Title Company |
|---|---|---|---|
| Peebles Richard C | $362,000 | -- | |
| Leatherwood Brett R | $330,000 | -- | |
| Goos Michael D | $290,000 | -- |
Source: Public Records
Mortgage History
| Date | Status | Borrower | Loan Amount |
|---|---|---|---|
| Previous Owner | Leatherwood Brett R | $318,986 | |
| Previous Owner | Goos Michael D | $190,000 |
Source: Public Records
Tax History
| Year | Tax Paid | Tax Assessment Tax Assessment Total Assessment is a certain percentage of the fair market value that is determined by local assessors to be the total taxable value of land and additions on the property. | Land | Improvement |
|---|---|---|---|---|
| 2025 | $6,610 | $168,872 | $23,244 | $145,628 |
| 2024 | $6,610 | $168,872 | $23,244 | $145,628 |
| 2023 | $6,652 | $168,872 | $23,244 | $145,628 |
| 2022 | $5,851 | $143,292 | $23,244 | $120,048 |
| 2021 | $5,770 | $141,304 | $23,244 | $118,060 |
| 2020 | $5,771 | $141,304 | $23,244 | $118,060 |
| 2019 | $4,206 | $116,328 | $23,244 | $93,084 |
| 2018 | $4,206 | $116,328 | $23,244 | $93,084 |
| 2017 | $4,221 | $116,328 | $23,244 | $93,084 |
| 2016 | $4,238 | $139,999 | $11,447 | $128,552 |
| 2015 | $4,243 | $115,999 | $11,447 | $104,552 |
| 2014 | $6,080 | $172,986 | $11,447 | $161,539 |
| 2013 | -- | $172,986 | $11,447 | $161,539 |
Source: Public Records
Map
Nearby Homes
- 1708 Carter Ave
- 1711 Stark Ave
- 1667 Carter Ave
- 1701 Stark Ave
- 1701 Carter Ave
- 1725 Stark Ave
- 1672 Wildwood Ave
- 1659 Carter Ave
- 1664 Carter Ave
- 1805 Stark Ave
- 1660 Wildwood Ave
- 1800 Carter Ave
- 1715 Carter Ave
- 2207 17th St
- 1653 Carter Ave
- 1708 Stark Ave
- 1652 Carter Ave
- 1720 Stark Ave
- 1815 Stark Ave
- 1654 Wildwood Ave
Your Personal Tour Guide
Ask me questions while you tour the home.