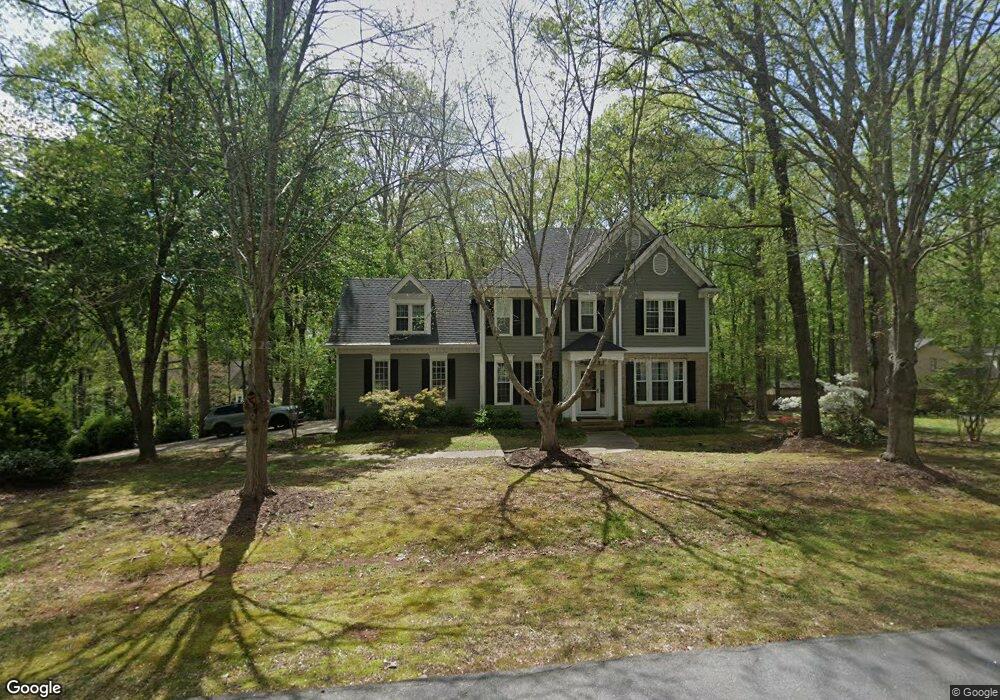
1700 Cordiss Ct Raleigh, NC 27603
Estimated Value: $465,936 - $501,000
3
Beds
3
Baths
2,323
Sq Ft
$209/Sq Ft
Est. Value
About This Home
This home is located at 1700 Cordiss Ct, Raleigh, NC 27603 and is currently estimated at $485,734, approximately $209 per square foot. 1700 Cordiss Ct is a home located in Wake County with nearby schools including Rand Road Elementary, North Garner Middle, and Garner High.
Ownership History
Date
Name
Owned For
Owner Type
Purchase Details
Closed on
Nov 6, 2019
Sold by
Hayford Nathaniel J and Hayford Shannon L
Bought by
Bumgardner Joshua D and Hansen Tanara Lee
Current Estimated Value
Home Financials for this Owner
Home Financials are based on the most recent Mortgage that was taken out on this home.
Original Mortgage
$242,400
Outstanding Balance
$213,250
Interest Rate
3.6%
Estimated Equity
$272,484
Purchase Details
Closed on
Aug 28, 2013
Sold by
Caldwell Steven R and Lusk Marcia Lynn
Bought by
Hayford Nathaniel J and Hayford Shannon L
Home Financials for this Owner
Home Financials are based on the most recent Mortgage that was taken out on this home.
Original Mortgage
$190,000
Interest Rate
4.37%
Mortgage Type
New Conventional
Purchase Details
Closed on
Mar 12, 1999
Sold by
Salmon David Craig
Bought by
Moeller Mark E and Moeller Kathy G
Home Financials for this Owner
Home Financials are based on the most recent Mortgage that was taken out on this home.
Original Mortgage
$198,000
Interest Rate
6.73%
Create a Home Valuation Report for This Property
The Home Valuation Report is an in-depth analysis detailing your home's value as well as a comparison with similar homes in the area
Home Values in the Area
Average Home Value in this Area
Purchase History
| Date | Buyer | Sale Price | Title Company |
|---|---|---|---|
| Bumgardner Joshua D | $303,000 | None Available | |
| Hayford Nathaniel J | $200,000 | None Available | |
| Moeller Mark E | $214,000 | -- |
Source: Public Records
Mortgage History
| Date | Status | Borrower | Loan Amount |
|---|---|---|---|
| Open | Bumgardner Joshua D | $242,400 | |
| Previous Owner | Hayford Nathaniel J | $190,000 | |
| Previous Owner | Moeller Mark E | $198,000 |
Source: Public Records
Tax History Compared to Growth
Tax History
| Year | Tax Paid | Tax Assessment Tax Assessment Total Assessment is a certain percentage of the fair market value that is determined by local assessors to be the total taxable value of land and additions on the property. | Land | Improvement |
|---|---|---|---|---|
| 2025 | $2,789 | $432,948 | $80,000 | $352,948 |
| 2024 | $2,709 | $432,948 | $80,000 | $352,948 |
| 2023 | $2,249 | $285,843 | $56,000 | $229,843 |
| 2022 | $2,084 | $285,843 | $56,000 | $229,843 |
| 2021 | $2,029 | $285,843 | $56,000 | $229,843 |
| 2020 | $1,995 | $285,843 | $56,000 | $229,843 |
| 2019 | $1,907 | $231,008 | $56,000 | $175,008 |
| 2018 | $1,753 | $231,008 | $56,000 | $175,008 |
| 2017 | $1,662 | $231,008 | $56,000 | $175,008 |
| 2016 | $1,629 | $231,008 | $56,000 | $175,008 |
| 2015 | $1,741 | $247,784 | $56,000 | $191,784 |
| 2014 | $1,650 | $247,784 | $56,000 | $191,784 |
Source: Public Records
Map
Nearby Homes
- 1017 Azalea Garden Cir
- 1025 Azalea Garden Cir
- 1033 Azalea Garden Cir
- 1037 Azalea Garden Cir
- 1041 Azalea Garden Cir
- 1045 Azalea Garden Cir
- 1053 Azalea Garden Cir
- 1057 Azalea Garden Cir
- 6501 Rock Service Station Rd
- 1061 Azalea Garden Cir
- 1021 Wintu Ct
- 1065 Azalea Garden Cir
- 1069 Azalea Garden Cir
- 6600 Rock Service Station Rd
- 6521 Camellia Creek Dr
- 936 Elbridge Dr
- 1220 Turner Woods Dr
- 1005 Turner Meadow Dr
- 1017 Widgeon Way
- 6121 Catandpolly Ln
- 1708 Cordiss Ct
- 6028 Hampton Ridge Rd
- 1704 Reynolda Ct
- 1709 Cordiss Ct
- 1701 Cordiss Ct
- 6033 Hampton Ridge Rd
- 6029 Hampton Ridge Rd
- 1708 Reynolda Ct
- 6101 Hampton Ridge Rd
- 6025 Hampton Ridge Rd
- 6104 Hampton Ridge Rd
- 1705 Reynolda Ct
- 1717 Reynolda Ct
- 6105 Hampton Ridge Rd
- 6021 Hampton Ridge Rd
- 6136 Wolverhampton Dr
- 1709 Reynolda Ct
- 6108 Hampton Ridge Rd
- 6020 Hampton Ridge Rd
- 6140 Wolverhampton Dr