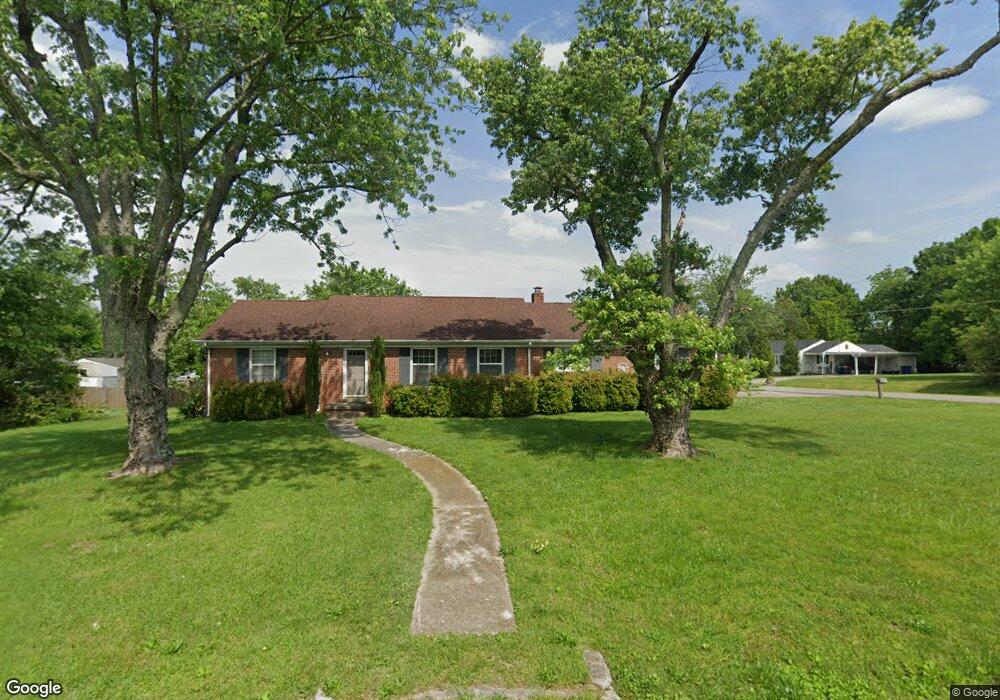
1700 Edmond Rd Shelbyville, TN 37160
Estimated Value: $269,000 - $319,000
4
Beds
2
Baths
1,900
Sq Ft
$157/Sq Ft
Est. Value
About This Home
This home is located at 1700 Edmond Rd, Shelbyville, TN 37160 and is currently estimated at $299,227, approximately $157 per square foot. 1700 Edmond Rd is a home located in Bedford County with nearby schools including Eakin Elementary School, Harris Middle School, and Victory Baptist Academy.
Ownership History
Date
Name
Owned For
Owner Type
Purchase Details
Closed on
Sep 16, 2016
Sold by
Bank Of America Na
Bought by
Brown David and Brown Ranea
Current Estimated Value
Purchase Details
Closed on
Jul 8, 2016
Sold by
Fabera John P
Bought by
Bank Of America
Purchase Details
Closed on
Aug 27, 2009
Sold by
Thompson Carl D
Bought by
Fabera John P
Purchase Details
Closed on
May 16, 2007
Sold by
Jordan Gene D
Bought by
Thompson Carl D
Purchase Details
Closed on
Jun 22, 2006
Sold by
Jordan Lailia J
Bought by
Jordan Gene D
Purchase Details
Closed on
Apr 19, 2006
Sold by
Jordan Sheryl Lee
Bought by
Jordan Gene D
Purchase Details
Closed on
Aug 12, 2005
Sold by
Molder Dorothy Jean
Bought by
Jordan Sheryl Lee
Purchase Details
Closed on
Jul 9, 1956
Bought by
Molder Charles A and Molder Dorothy J
Purchase Details
Closed on
Jan 8, 1951
Create a Home Valuation Report for This Property
The Home Valuation Report is an in-depth analysis detailing your home's value as well as a comparison with similar homes in the area
Home Values in the Area
Average Home Value in this Area
Purchase History
| Date | Buyer | Sale Price | Title Company |
|---|---|---|---|
| Brown David | $110,000 | -- | |
| Bank Of America | $122,760 | -- | |
| Fabera John P | $127,500 | -- | |
| Thompson Carl D | $118,000 | -- | |
| Jordan Gene D | -- | -- | |
| Jordan Gene D | -- | -- | |
| Jordan Sheryl Lee | $98,500 | -- | |
| Molder Charles A | -- | -- | |
| -- | -- | -- |
Source: Public Records
Tax History Compared to Growth
Tax History
| Year | Tax Paid | Tax Assessment Tax Assessment Total Assessment is a certain percentage of the fair market value that is determined by local assessors to be the total taxable value of land and additions on the property. | Land | Improvement |
|---|---|---|---|---|
| 2025 | -- | $51,225 | $0 | $0 |
| 2024 | -- | $51,225 | $8,000 | $43,225 |
| 2023 | $758 | $51,225 | $8,000 | $43,225 |
| 2022 | $2,005 | $51,225 | $8,000 | $43,225 |
| 2021 | $1,821 | $51,225 | $8,000 | $43,225 |
| 2020 | $1,166 | $51,225 | $8,000 | $43,225 |
| 2019 | $1,166 | $26,325 | $4,000 | $22,325 |
| 2018 | $1,140 | $26,325 | $4,000 | $22,325 |
| 2017 | $1,140 | $26,325 | $4,000 | $22,325 |
| 2016 | $1,129 | $26,325 | $4,000 | $22,325 |
| 2015 | $1,129 | $26,325 | $4,000 | $22,325 |
| 2014 | $979 | $24,970 | $0 | $0 |
Source: Public Records
Map
Nearby Homes