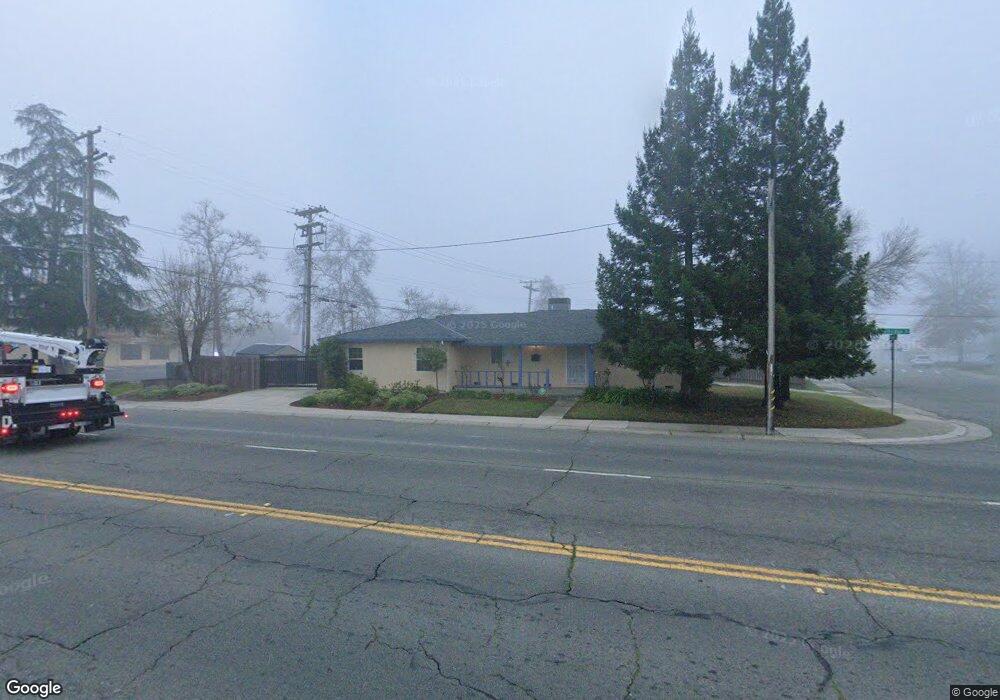
1700 Fruitridge Rd Sacramento, CA 95822
South Land Park NeighborhoodEstimated Value: $370,000 - $543,000
2
Beds
1
Bath
951
Sq Ft
$499/Sq Ft
Est. Value
About This Home
This home is located at 1700 Fruitridge Rd, Sacramento, CA 95822 and is currently estimated at $474,477, approximately $498 per square foot. 1700 Fruitridge Rd is a home located in Sacramento County with nearby schools including Sutterville Elementary School, California Middle, and C. K. McClatchy High.
Ownership History
Date
Name
Owned For
Owner Type
Purchase Details
Closed on
Mar 14, 2013
Sold by
Fong Alex K
Bought by
Liu Zhi
Current Estimated Value
Home Financials for this Owner
Home Financials are based on the most recent Mortgage that was taken out on this home.
Original Mortgage
$105,311
Outstanding Balance
$73,331
Interest Rate
3.25%
Mortgage Type
FHA
Estimated Equity
$401,146
Purchase Details
Closed on
Aug 8, 2012
Sold by
Morishita Misty
Bought by
Fong Alex K
Purchase Details
Closed on
Jul 12, 2011
Sold by
Spieth Terry E
Bought by
Morishita Misty
Purchase Details
Closed on
Oct 29, 2002
Sold by
Manisap Michelle Bouasy
Bought by
Spieth Terry E
Home Financials for this Owner
Home Financials are based on the most recent Mortgage that was taken out on this home.
Original Mortgage
$165,300
Interest Rate
5.99%
Purchase Details
Closed on
Aug 8, 2002
Sold by
Kuniyoshi Kathy
Bought by
Manisap Michelle Bouasy
Create a Home Valuation Report for This Property
The Home Valuation Report is an in-depth analysis detailing your home's value as well as a comparison with similar homes in the area
Home Values in the Area
Average Home Value in this Area
Purchase History
| Date | Buyer | Sale Price | Title Company |
|---|---|---|---|
| Liu Zhi | $115,000 | Placer Title Company | |
| Fong Alex K | $39,000 | None Available | |
| Morishita Misty | $77,419 | None Available | |
| Spieth Terry E | $174,000 | Alliance Title Company | |
| Manisap Michelle Bouasy | $73,000 | -- |
Source: Public Records
Mortgage History
| Date | Status | Borrower | Loan Amount |
|---|---|---|---|
| Open | Liu Zhi | $105,311 | |
| Previous Owner | Spieth Terry E | $165,300 |
Source: Public Records
Tax History Compared to Growth
Tax History
| Year | Tax Paid | Tax Assessment Tax Assessment Total Assessment is a certain percentage of the fair market value that is determined by local assessors to be the total taxable value of land and additions on the property. | Land | Improvement |
|---|---|---|---|---|
| 2025 | $2,440 | $195,687 | $61,567 | $134,120 |
| 2024 | $2,440 | $191,851 | $60,360 | $131,491 |
| 2023 | $2,382 | $188,090 | $59,177 | $128,913 |
| 2022 | $2,340 | $184,403 | $58,017 | $126,386 |
| 2021 | $2,233 | $180,788 | $56,880 | $123,908 |
| 2020 | $2,245 | $178,935 | $56,297 | $122,638 |
| 2019 | $2,198 | $175,428 | $55,194 | $120,234 |
| 2018 | $2,140 | $171,989 | $54,112 | $117,877 |
| 2017 | $2,110 | $168,617 | $53,051 | $115,566 |
| 2016 | $2,002 | $165,311 | $52,011 | $113,300 |
| 2015 | $1,457 | $117,829 | $51,230 | $66,599 |
| 2014 | $1,401 | $115,522 | $50,227 | $65,295 |
Source: Public Records
Map
Nearby Homes
- 1621 Fruitridge Rd
- 5531 Michael Way
- 1433 32nd Ave
- 1810 Opper Ave
- 1548 London St
- 1432 Oregon Dr
- 1428 Tradewinds Ave
- 1436 Sterling St
- 2117 Fruitridge Rd
- 4989 Virginia Way
- 5200 Pleasant Dr
- 2225 Irvin Way
- 5440 Pleasant Dr
- 1224 Nevis Ct
- 5604 Johns Dr
- 1220 Lucio Ln
- 5779 Gloria Dr
- 6058 13th St
- 4500 Crestwood Way
- 4913 23rd St
- 5605 Rickey Dr
- 5609 Rickey Dr
- 1624 Fruitridge Rd
- 1701 Fruitridge Rd
- 1711 Fruitridge Rd
- 5613 Rickey Dr
- 5540 Ashland Way
- 1641 Fruitridge Rd
- 5608 Rickey Dr
- 1728 Fruitridge Rd
- 1620 Fruitridge Rd
- 5617 Rickey Dr
- 5612 Rickey Dr
- 5541 Ashland Way
- 1700 Shirley Dr
- 1710 Shirley Dr
- 1640 Shirley Dr
- 1616 Fruitridge Rd
- 5520 Ashland Way
- 5621 Rickey Dr