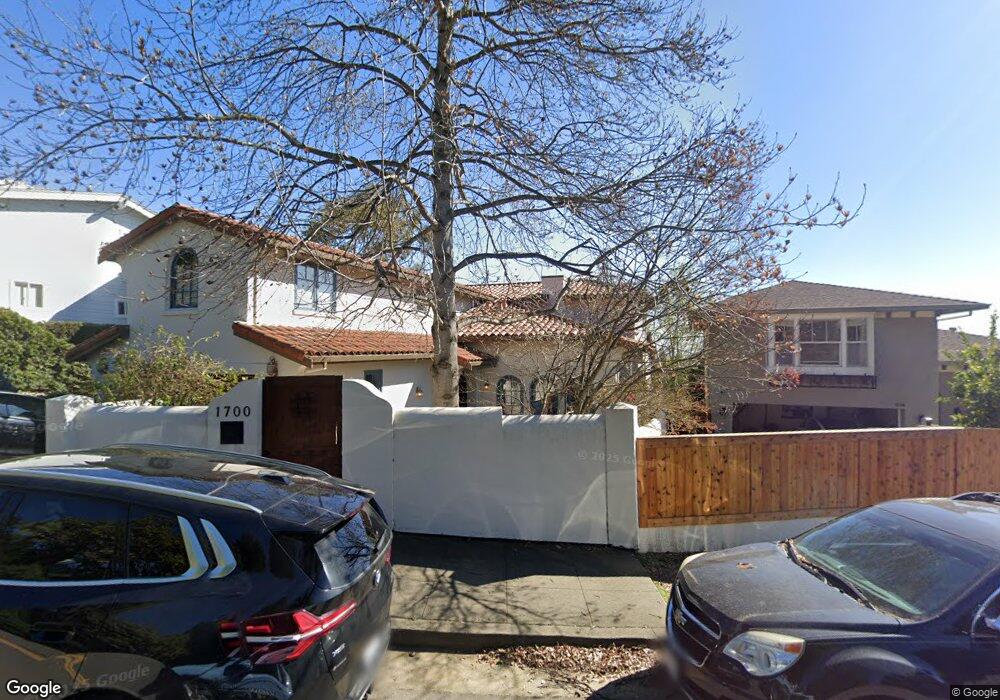
1700 Grand View Dr Berkeley, CA 94705
Claremont Hills NeighborhoodEstimated Value: $2,452,605 - $3,469,000
5
Beds
4
Baths
4,685
Sq Ft
$662/Sq Ft
Est. Value
About This Home
This home is located at 1700 Grand View Dr, Berkeley, CA 94705 and is currently estimated at $3,099,401, approximately $661 per square foot. 1700 Grand View Dr is a home located in Alameda County with nearby schools including Chabot Elementary School, Thornhill Elementary School, and Claremont Middle School.
Ownership History
Date
Name
Owned For
Owner Type
Purchase Details
Closed on
Jun 2, 2011
Sold by
Keller James A
Bought by
Keller James Albert
Current Estimated Value
Purchase Details
Closed on
Mar 20, 2002
Sold by
Weale Howard and Weale Sylvia
Bought by
Keller James A
Home Financials for this Owner
Home Financials are based on the most recent Mortgage that was taken out on this home.
Original Mortgage
$300,000
Interest Rate
6.78%
Mortgage Type
Balloon
Purchase Details
Closed on
Jul 16, 1999
Sold by
Mont Blanc Development
Bought by
Weale Howard
Home Financials for this Owner
Home Financials are based on the most recent Mortgage that was taken out on this home.
Original Mortgage
$570,000
Interest Rate
7.51%
Mortgage Type
Stand Alone First
Purchase Details
Closed on
Apr 16, 1998
Sold by
Jo Brucker H and Jo Omalley
Bought by
Mont Blanc Development
Create a Home Valuation Report for This Property
The Home Valuation Report is an in-depth analysis detailing your home's value as well as a comparison with similar homes in the area
Home Values in the Area
Average Home Value in this Area
Purchase History
| Date | Buyer | Sale Price | Title Company |
|---|---|---|---|
| Keller James Albert | -- | None Available | |
| Keller James A | $1,275,000 | Old Republic Title Company | |
| Weale Howard | $970,000 | Fidelity National Title Co | |
| Mont Blanc Development | $245,000 | Chicago Title Co |
Source: Public Records
Mortgage History
| Date | Status | Borrower | Loan Amount |
|---|---|---|---|
| Closed | Keller James A | $300,000 | |
| Previous Owner | Weale Howard | $570,000 | |
| Closed | Keller James A | $300,000 |
Source: Public Records
Tax History
| Year | Tax Paid | Tax Assessment Tax Assessment Total Assessment is a certain percentage of the fair market value that is determined by local assessors to be the total taxable value of land and additions on the property. | Land | Improvement |
|---|---|---|---|---|
| 2025 | $25,498 | $1,883,430 | $565,029 | $1,318,401 |
| 2024 | $25,498 | $1,846,505 | $553,951 | $1,292,554 |
| 2023 | $26,987 | $1,810,308 | $543,092 | $1,267,216 |
| 2022 | $26,481 | $1,774,811 | $532,443 | $1,242,368 |
| 2021 | $25,731 | $1,740,017 | $522,005 | $1,218,012 |
| 2020 | $25,448 | $1,722,180 | $516,654 | $1,205,526 |
| 2019 | $24,724 | $1,688,418 | $506,525 | $1,181,893 |
| 2018 | $24,198 | $1,655,318 | $496,595 | $1,158,723 |
| 2017 | $23,357 | $1,622,870 | $486,861 | $1,136,009 |
| 2016 | $22,807 | $1,591,058 | $477,317 | $1,113,741 |
| 2015 | $22,691 | $1,567,165 | $470,149 | $1,097,016 |
| 2014 | $23,025 | $1,536,476 | $460,943 | $1,075,533 |
Source: Public Records
Map
Nearby Homes
- 1426 Grand View Dr
- 1881 Grand View Dr
- 29 Live Oak Rd
- 1102 Grand View Dr
- 11 Hawks Hill Ct
- 0 Charing Cross Rd Unit 41127396
- 150 Vicente Rd
- 6869 Bristol Dr
- 7041 Devon Way
- 45 Vicente Rd
- 6839 Sherwick Dr
- 0 Tunnel Rd
- 6971 Bristol Dr
- 6716 Charing Cross Rd
- 0 Buckingham Blvd Unit 41115384
- 7003 Buckingham Blvd
- 142 Gravatt Dr
- 0 Dartmouth Dr
- 7101 Marlborough Terrace
- 1488 Alvarado Rd
- 1830 Grand View Dr
- 1638 Grand View Dr
- 15 Treasure Hill
- 1650 Grand View Dr
- 1680 Grand View Dr
- 11 Treasure Hill
- 20 Treasure Hill
- 18 Treasure Hill
- 1834 Grand View Dr
- 1628 Grand View Dr
- 16 Treasure Hill
- 1832 Grand View Dr
- 9 Treasure Hill
- 1836 Grand View Dr
- 7 Treasure Hill
- 1600 Grand View Dr
- 1600 Grand View Dr
- 1601 Grand View Dr
- 1838 Grand View Dr
- 1615 Grand View Dr
Your Personal Tour Guide
Ask me questions while you tour the home.